February 2025
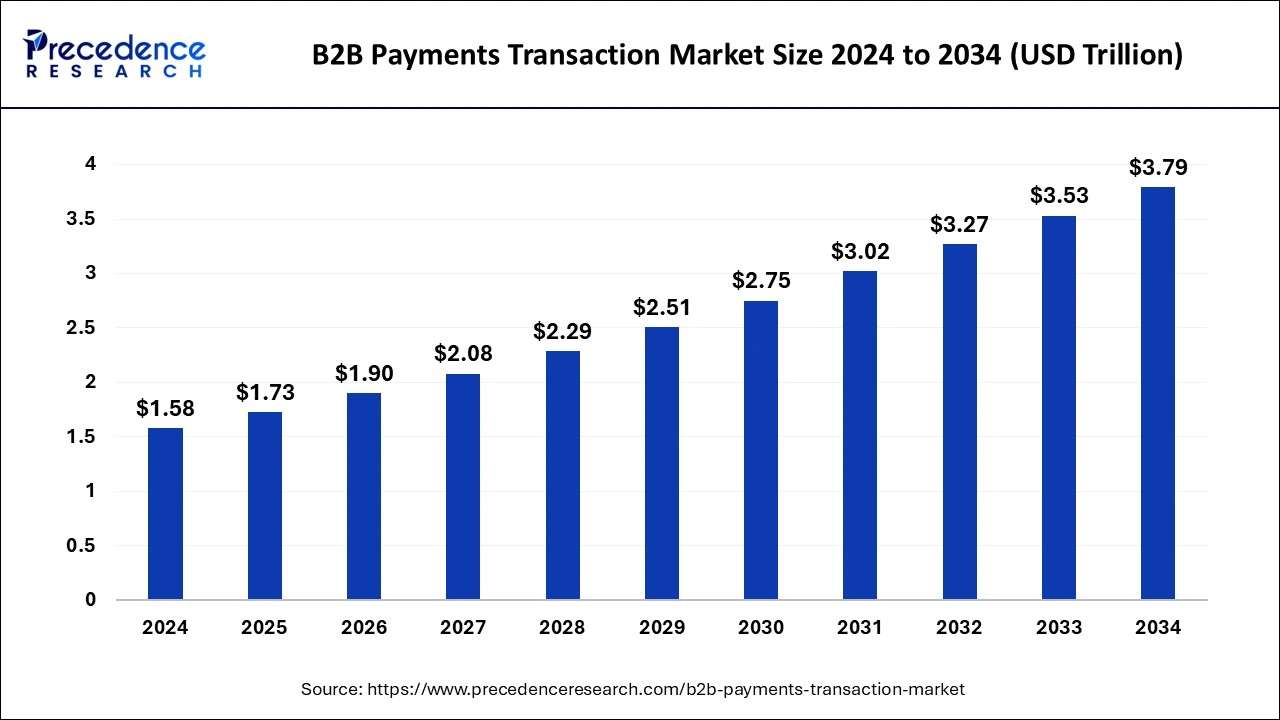
The global B2B payments transaction market size is calculated at USD 1.73 trillion in 2025 and is forecasted to reach around USD 3.79 trillion by 2034, accelerating at a CAGR of 9.14% from 2025 to 2034. The North America market size surpassed USD 660 billion in 2024 and is expanding at a CAGR of 9.20% during the forecast period. The market sizing and forecasts are revenue-based (USD Million/Billion), with 2024 as the base year.
The global B2B payments transaction market size accounted for USD 1.58 trillion in 2024 and is expected to exceed around USD 3.79 trillion by 2034, growing at a CAGR of 9.14% from 2025 to 2034.
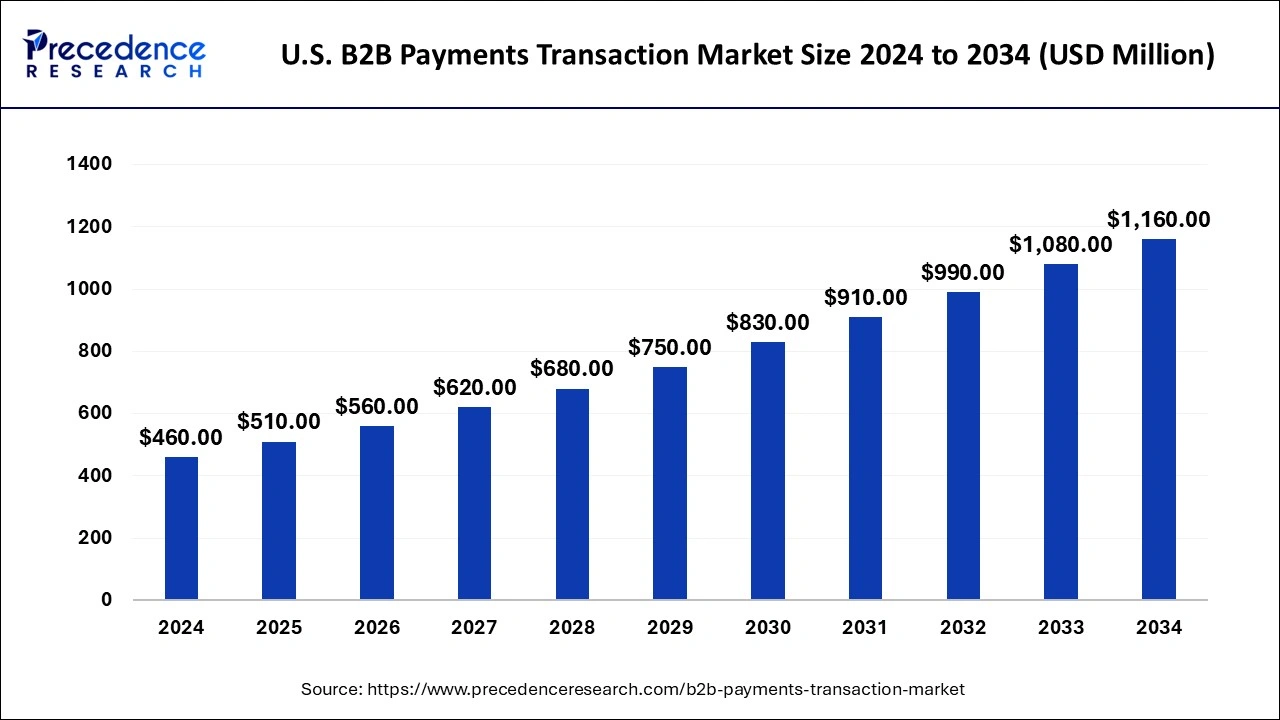
The U.S. B2B payments transaction market size was evaluated at USD 460 billion in 2024 and is projected to be worth around USD 1,160 billion by 2034, growing at a CAGR of 9.69% from 2025 to 2034.
North America dominated the B2B Payments Transaction market and accounted for the largest revenue share of 41.2% in 2024. The growth of the market in this region is mainly driven by the availability of advanced infrastructure that helps facilitate online payment. In addition to this, the high spending by the U.S. And Canada government on securing the transaction network, coupled with the availability of standard rules and regulations pertaining to online payment is further anticipated to encourage the growth of the market in this region.
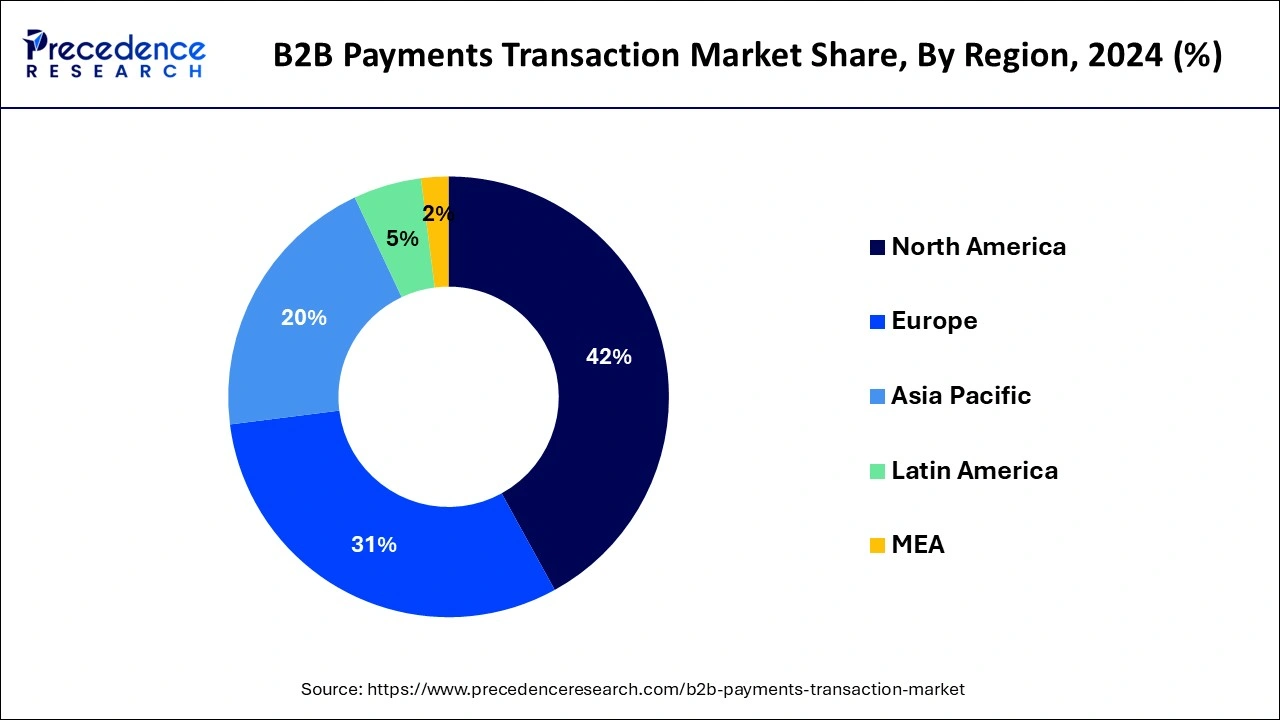
On the other hand, Asia Pacific is projected to witness the fastest growth rate throughout the forecast period. The ongoing proliferation of the business-to-business eCommerce market as well as the surge in the adoption of financial technology in the region primarily drives the growth of the B2B Payments Transaction market. In addition to this, the region has witnessed a significant increase in penetration of smartphones and the internet, along with the high spending capacity of customers. This factor has considerably pushed demand for B2B payment transaction solutions in the country.
Growth of the global B2B payments transaction market is mainly driven by rapid expansion of trades across the globe due to an increased import and export of goods & services. Businesses are actively looking for dealing with various countries for their expansion, which boosts the cross-border business transactions. In addition to this, volume of total B2B payments has seen significant growth in past few years. For instance, it has been assessed that the volume totals of B2B payments is approximately $120 trillion per year worldwide. In addition to this, growth in number of online payment activities along with the government initiatives in developing countries for cashless economy boosts growth of the B2B payments transaction market.
Moreover, rapid trend among the domestic small and medium sized companies to engage in massive trades act as one of the key driving forces for growth of the B2B payments market.
Furthermore, integration of automation technology in B2B payment transaction is anticipated to create lucrative growth opportunities for the market growth. For instance, the paper checks are being completely replaced by electronic transfers as well as more advanced digital B2B payment solutions are being adopted which are more effective in terms of financial services.
| Report Highlights | Details |
| Growth Rate from 2025 to 2034 | CAGR of 9.14% |
| Market Size in 2025 | USD 1.58 Trillion |
| Market Size by 2034 | USD 3.79 Trillion |
| Largest Market | North America |
| Base year | 2024 |
| Forecast Period | 2025 to 2034 |
| Segments Covered | Payment Type, Enterprise Size, Payment Mode, Industry Vertical |
| Regional Scope | North America, Europe, Asia Pacific, Middle East & Africa, South America |
Domestic Payments dominated the market with around 65% share in terms of revenue of the total market. Growth of this segment is mainly attributed to an upsurge in a number of small and medium-sized enterprises in countries such as India and China that demand payment solutions. Such businesses are rapidly using payment solutions such as Fundbox Pay, PayPal, Square, QuickBooks, and Plastic.
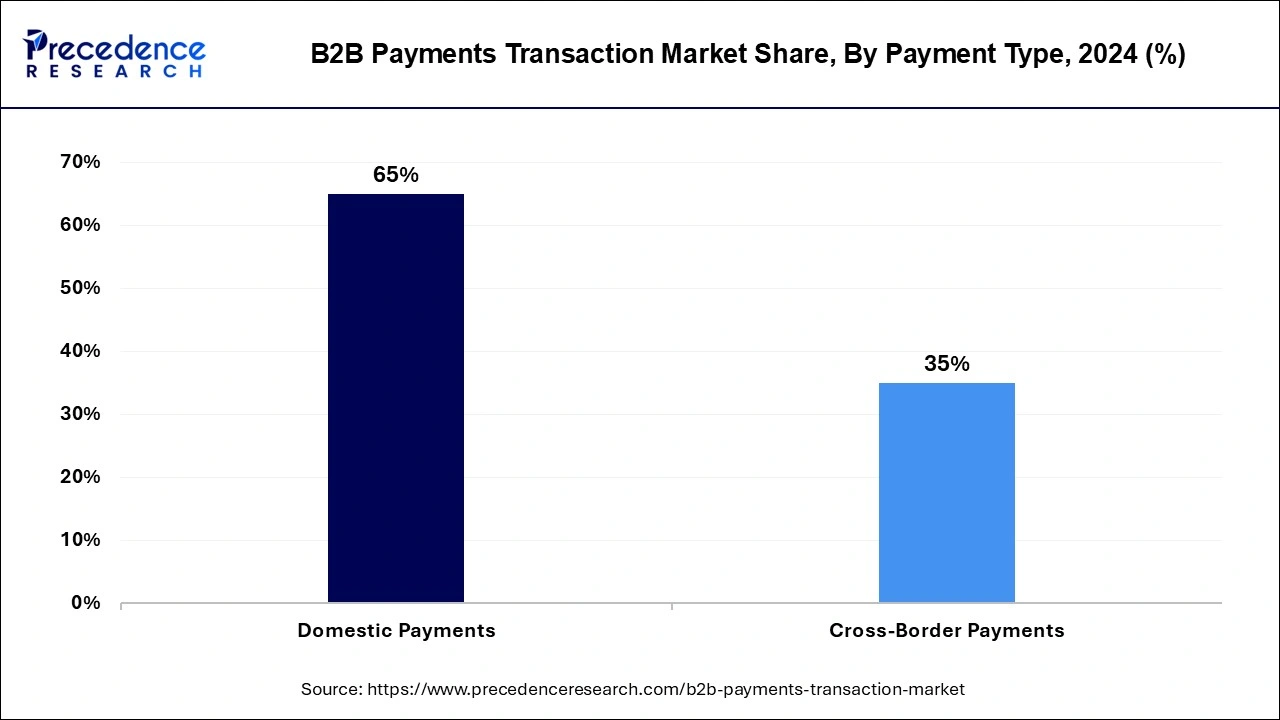
However, cross-border payments segment is anticipated to generate high revenue in the years to come. In this type of transaction, the payee and the transaction recipient are based in different countries. Hence, rising import and export of goods & services fuel the growth of this segment.
Large enterprises dominated the market with around 55% share in terms of revenue of the total market. The growth of this segment is mainly attributed to rising B2B payment transactions among large manufacturers and wholesalers. For instance, Samsung Electronics is one of the largest suppliers to Apple Inc. for the production of the iPhone. However, Apple Inc. holds B2B relationships with firms such as Panasonic, Intel, and semiconductor producer Micron Technology.
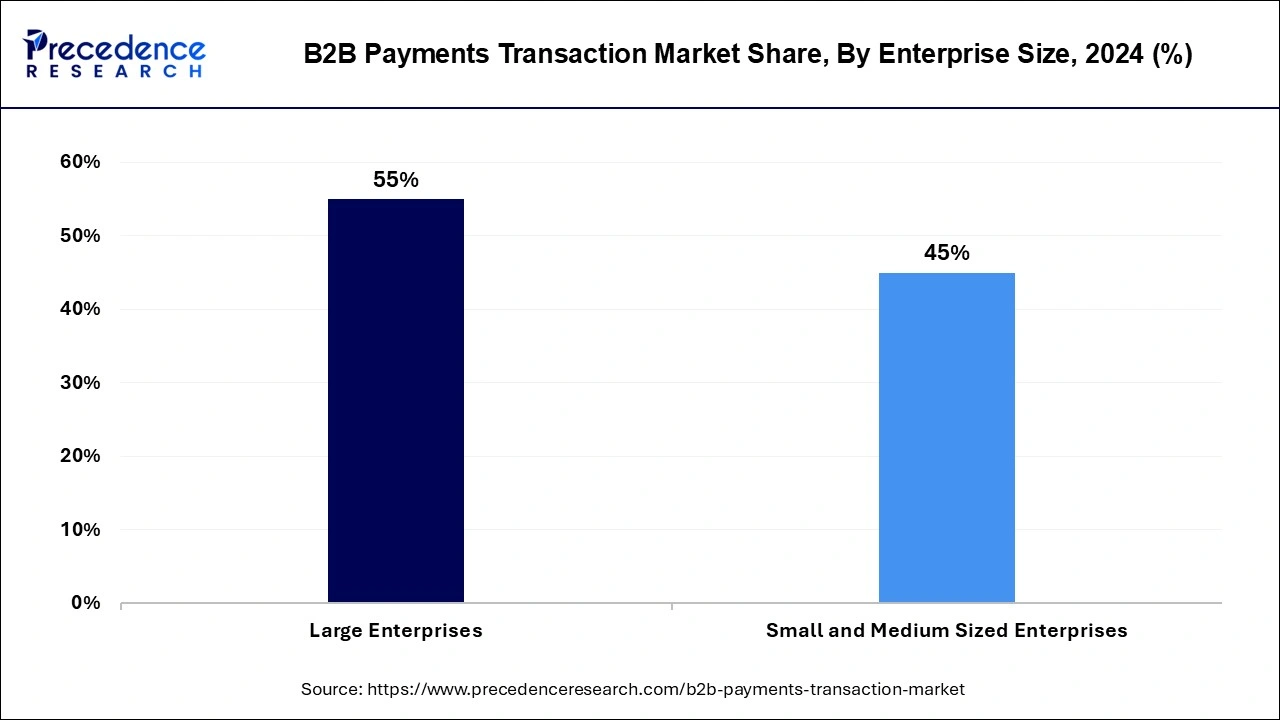
However, the small and medium-sized enterprises segment is expected to witness the highest growth rate during the forecast period.
The traditional segment dominated the market with around 66% share in terms of revenue of the total market. This is on account of the current preference by large companies for traditional payments such as bank wire transfers. For instance, as per recent studies, when it comes to B2B E-Commerce, credit card was the first choice of B2B enterprises in 2024, followed by mobile wallets.
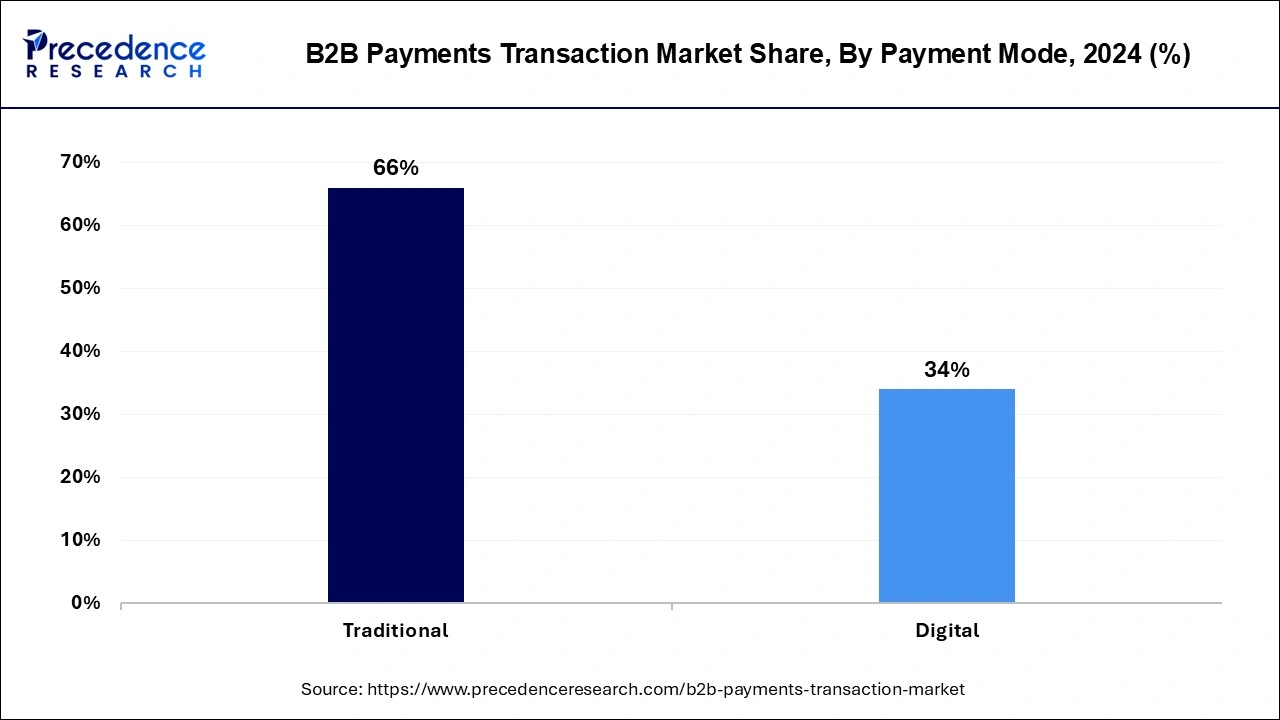
However, the digital payment mode segment is expected to witness the highest growth rate during the forecast period. The growth of this segment is mainly attributed to the ability of digital payment to free up time, money, and energy to grow and scale the business.
Key Companies & Market Share Insights
The market is moderately fragmented with the presence of several local companies. These market players are striving to gain higher market share by adopting strategies, such as investments, partnerships, and acquisitions & mergers. Companies are also spending on the development of improved payment solutions to meet payment demands among the businesses.
Furthermore, the market players are making efforts to create competitive technology solutions and to meet their clients’ international business needs. For instance, in November 2019, Citi, an American multinational investment bank and financial services corporation launched a cross-border platform to help its multinational clients manage the complexities in collecting cross border business-to-business payments, by digitization of the transaction process.
By Payment Type
By Enterprise Size
By Payment Mode
By Industry Vertical
By Geography
For inquiries regarding discounts, bulk purchases, or customization requests, please contact us at sales@precedenceresearch.com
No cookie-cutter, only authentic analysis – take the 1st step to become a Precedence Research client
February 2025
February 2025
July 2024