November 2024
Enterprise Asset Management Market (By Component: Solutions, Services; By Application: Asset lifecycle management, Labor management, Inventory management, Predictive maintenance, Work order management; By Organization: Large enterprises, Small and medium enterprises; By Deployment: Cloud, On premises; By End User) - Global Industry Analysis, Size, Share, Growth, Trends, Regional Outlook, and Forecast 2024-2033
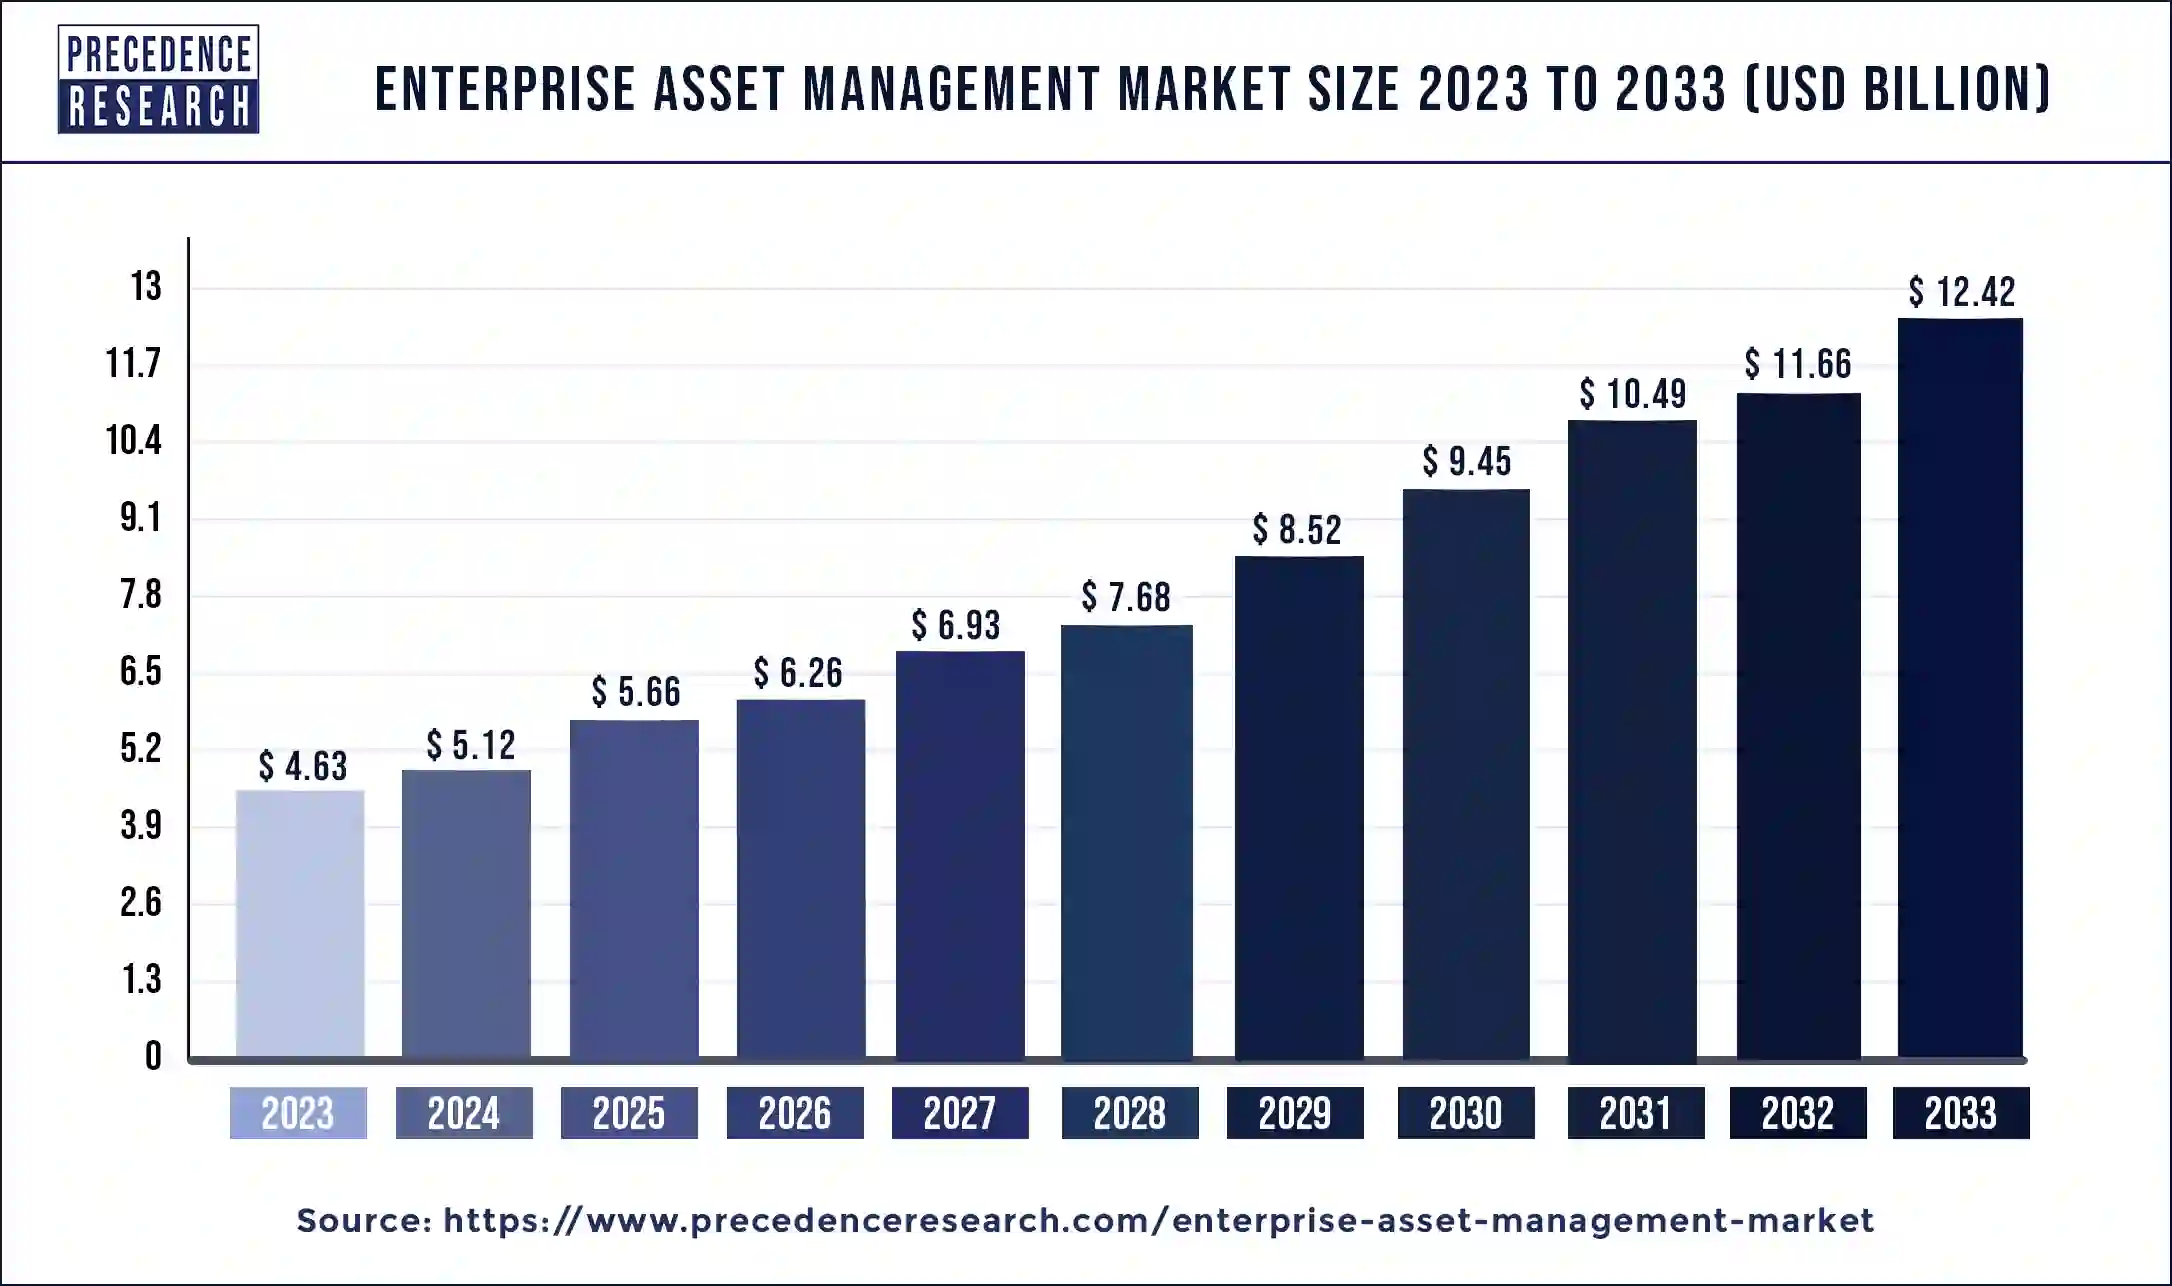
The global enterprise asset management market size was valued at USD 4.63 billion in 2023 and is expected to hit around USD 12.42 billion by 2033, poised to grow at a compound annual growth rate (CAGR) of 10.35% during the forecast period 2024 to 2033. North America enterprise asset management market size was estimated at USD 1.50 billion in 2023.

Enterprise asset management is extremely beneficial for the organizations as it helps in the planning, optimization, execution and tracking of all the activities of maintenance according to the priorities, tools, materials, cost, skills and different types of information. Enterprise asset management market is expected to grow well in the coming years as it helps in improving the performance of the assets and helps in the growth of the industries or businesses.
From the time of procuring different types of physical assets like buildings, equipment, vehicles and machines till the time these assets are disposed they are trapped with the help of tools and processes that also help in their management and all of these are provided through the enterprise asset management system.
The use of these systems is expected to grow in the coming years as it is dependent on the physical infrastructure. The use of cloud-based systems and integration of big data will help in the growth of the enterprise asset management market in the coming years and it will also provide major opportunities for the growth of the business during the forecast period.
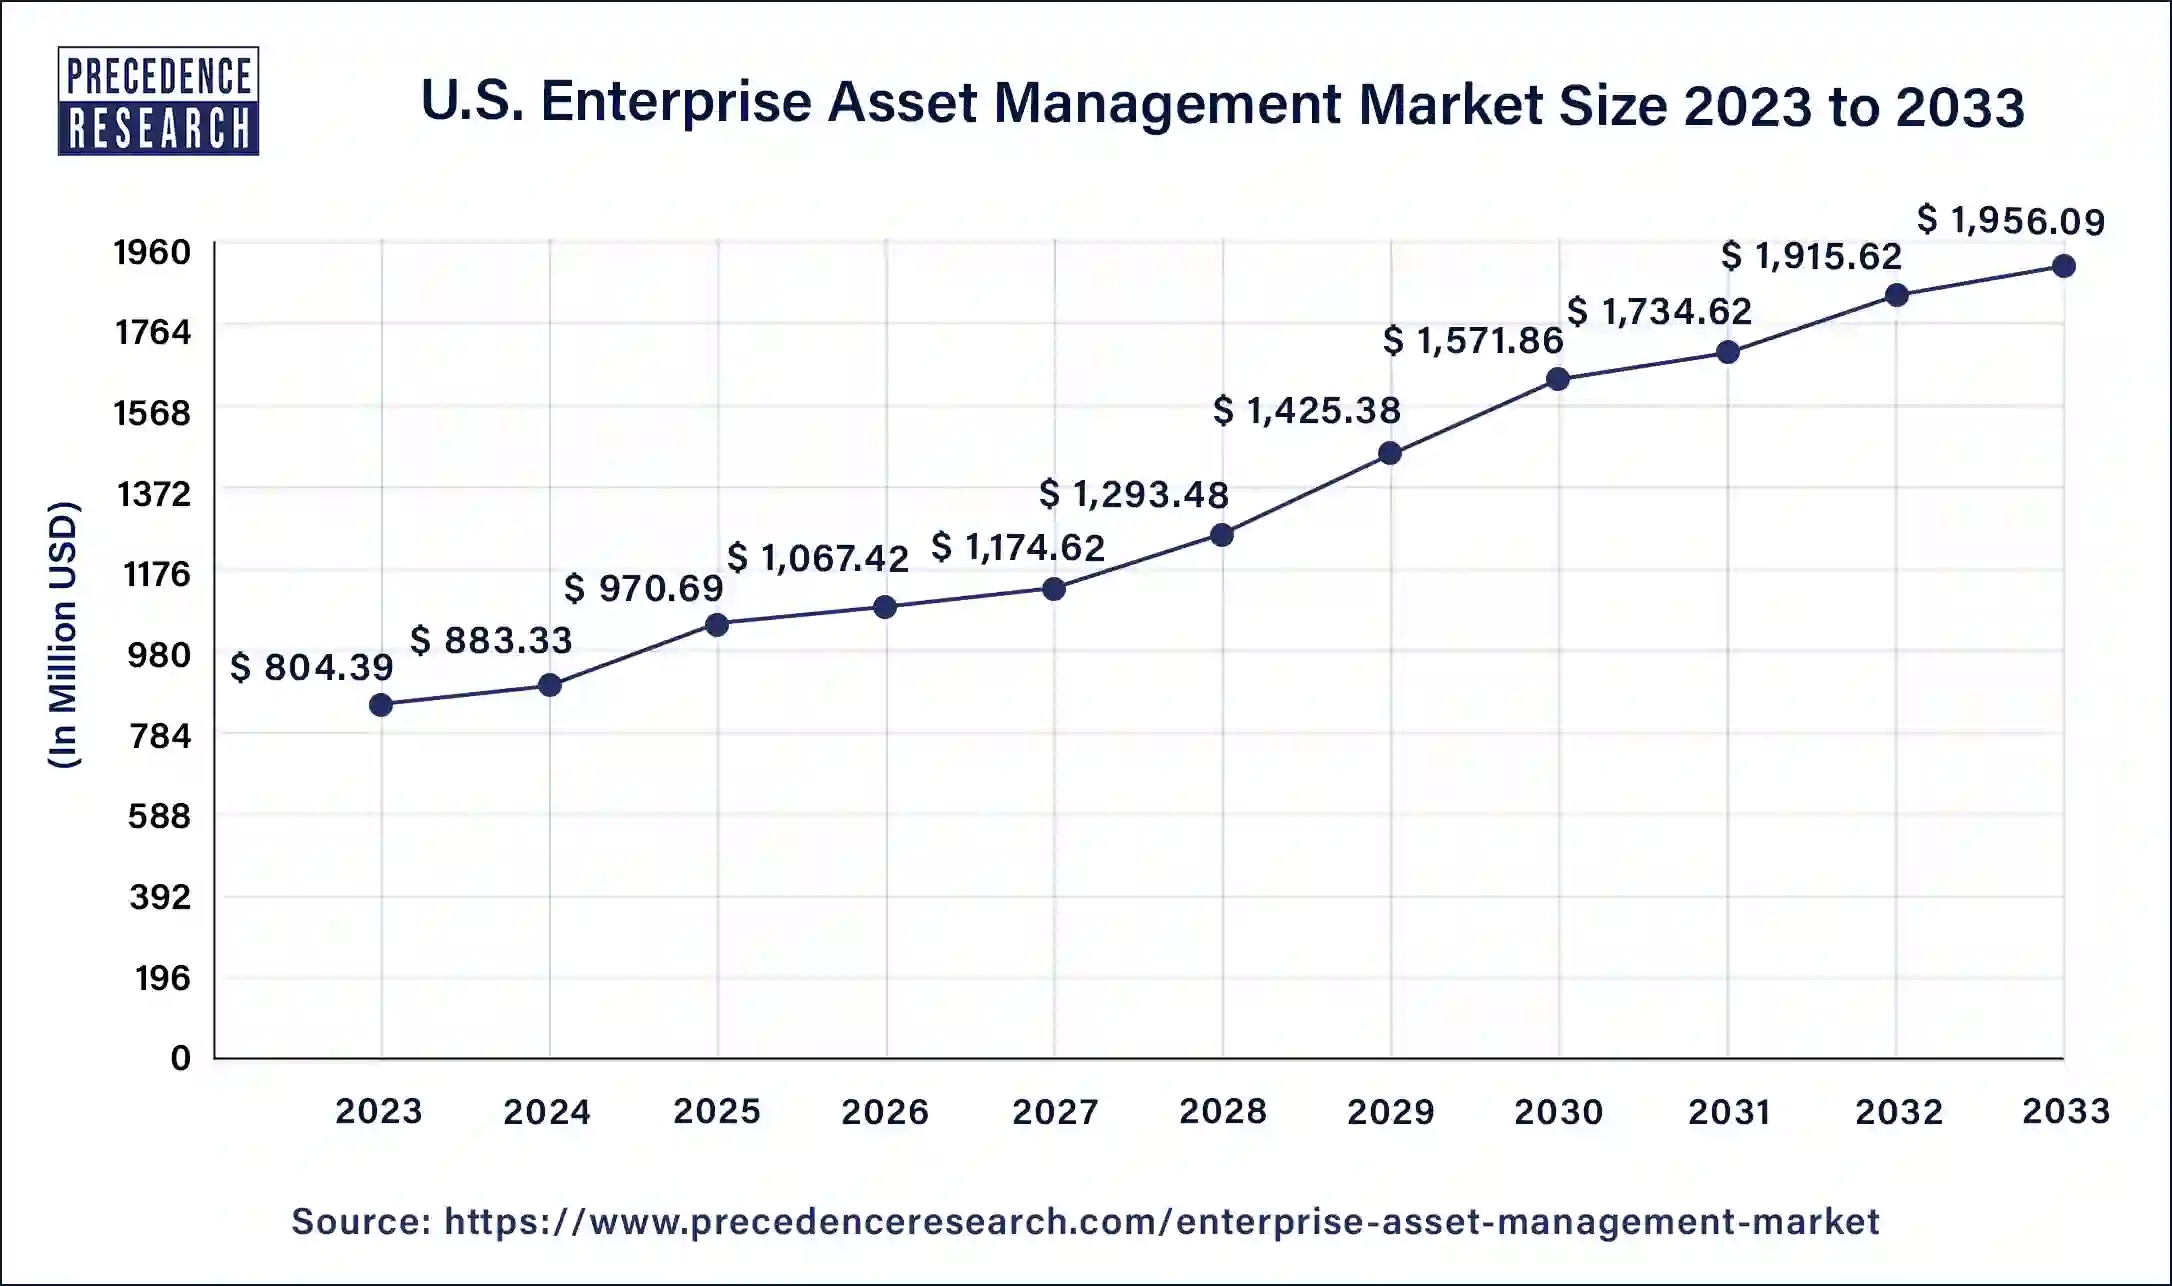
The U.S. enterprise asset management market size was estimated at USD 804.39 million in 2023 and is expected to bne worth around USD 1,956.09 million by 2033, poised to grow at a CAGR of 9.29% from 2024 to 2033.

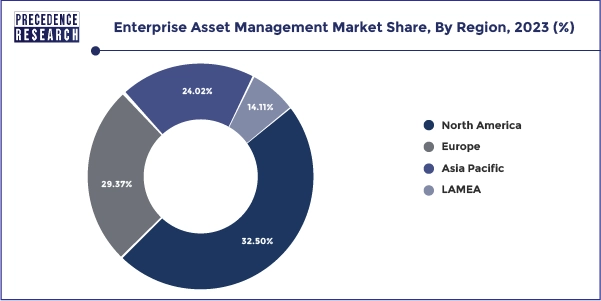
On the basis of geography, the North American region has dominated the market in the past with a maximum share in terms of revenue and it is expected to grow well in the coming years. The demand for enterprise asset management solutions has grown to a great extent in the North American region due to the availability of new technologies. The use of Internet of Things in various industries has increased due to which the market is expected to grow well in the coming years. Internet of Things plays an instrumental role in deriving and monitoring data from different sites.

Apart from the North American region the Asia Pacific region is also expected to see or significant growth in the coming years. Some of the factors that will help in the growth of the Asia Pacific regional rocket are an increase of suppliers that provide enterprise asset management, Stringent regulatory policies associated with the management of the assets and Other favorable aids provided by the government for the enterprise asset management.
| Report Coverage | Details |
| Market Size in 2023 |
USD 4.63 Billion |
| Market Size by 2033 |
USD 12.42 Billion |
| Growth Rate from 2024 to 2033 | CAGR of 10.35% |
| Base Year | 2023 |
| Forecast Period | 2024 to 2033 |
| Segments Covered | Component, Application, Organization, Deployment, End User, and Geography |
| Companies Mentioned |
IBM (US), SAP (Germany), Oracle (US), Infor (US), IFS (Sweden), ABB (Switzerland), CGI (Canada), Rfgen Software (US), Assetworks (US), Ultimo Software Solutions (UK), UpKeep (US), Asset Panda (US), EZOfficeInventory (US), Intelligent Process Solutions (Germany), Maintenance Connection (US), Aveva (UK), Aptean (US), Emanit (US), EZMaintain.com (US), Pazo (India), Asset Infinity (India), KloudGin (US), Fracttal (Chile), InnoMaint Software (India), Aladinme (UAE), Limble (US), Redlist (US), TrackX (US), Cheqroom (Belgium), The Asset Guardian (Canada), GoCodes (US) |
The demand for the enterprise asset management systems is expected to grow in the coming years as the businesses seek better productivity. Enterprise asset management systems are also used on a large scale in streamline processes. It also helps in managing various facilities of the organization. The services provided by the use of the enterprise asset management cloud-based software will help in optimizing the assets of the corporates and it also helps in better decision making as it provides us an analysis of the business.
The amount of money spent on the overheads is also reduced due to the use of the enterprise asset management systems. They offer better services and support through the use of the cloud-based systems. These systems also provide monitoring tools for the performance of the organization. As there has been an increased demand for the cloud-based enterprise asset management solutions in the recent years the market is expected to grow well during the forecast period. Most of the basic operations in various organizations are enhanced due to the use of the enterprise asset management softwares. And the investments made by the organization in acquiring these softwares there's nothing as compared to the benefits associated with the use of these softwares.
What are the market drivers of the enterprise asset management market?
What are the challenges in the enterprise asset management market?
What are the opportunities in the enterprise asset management market?
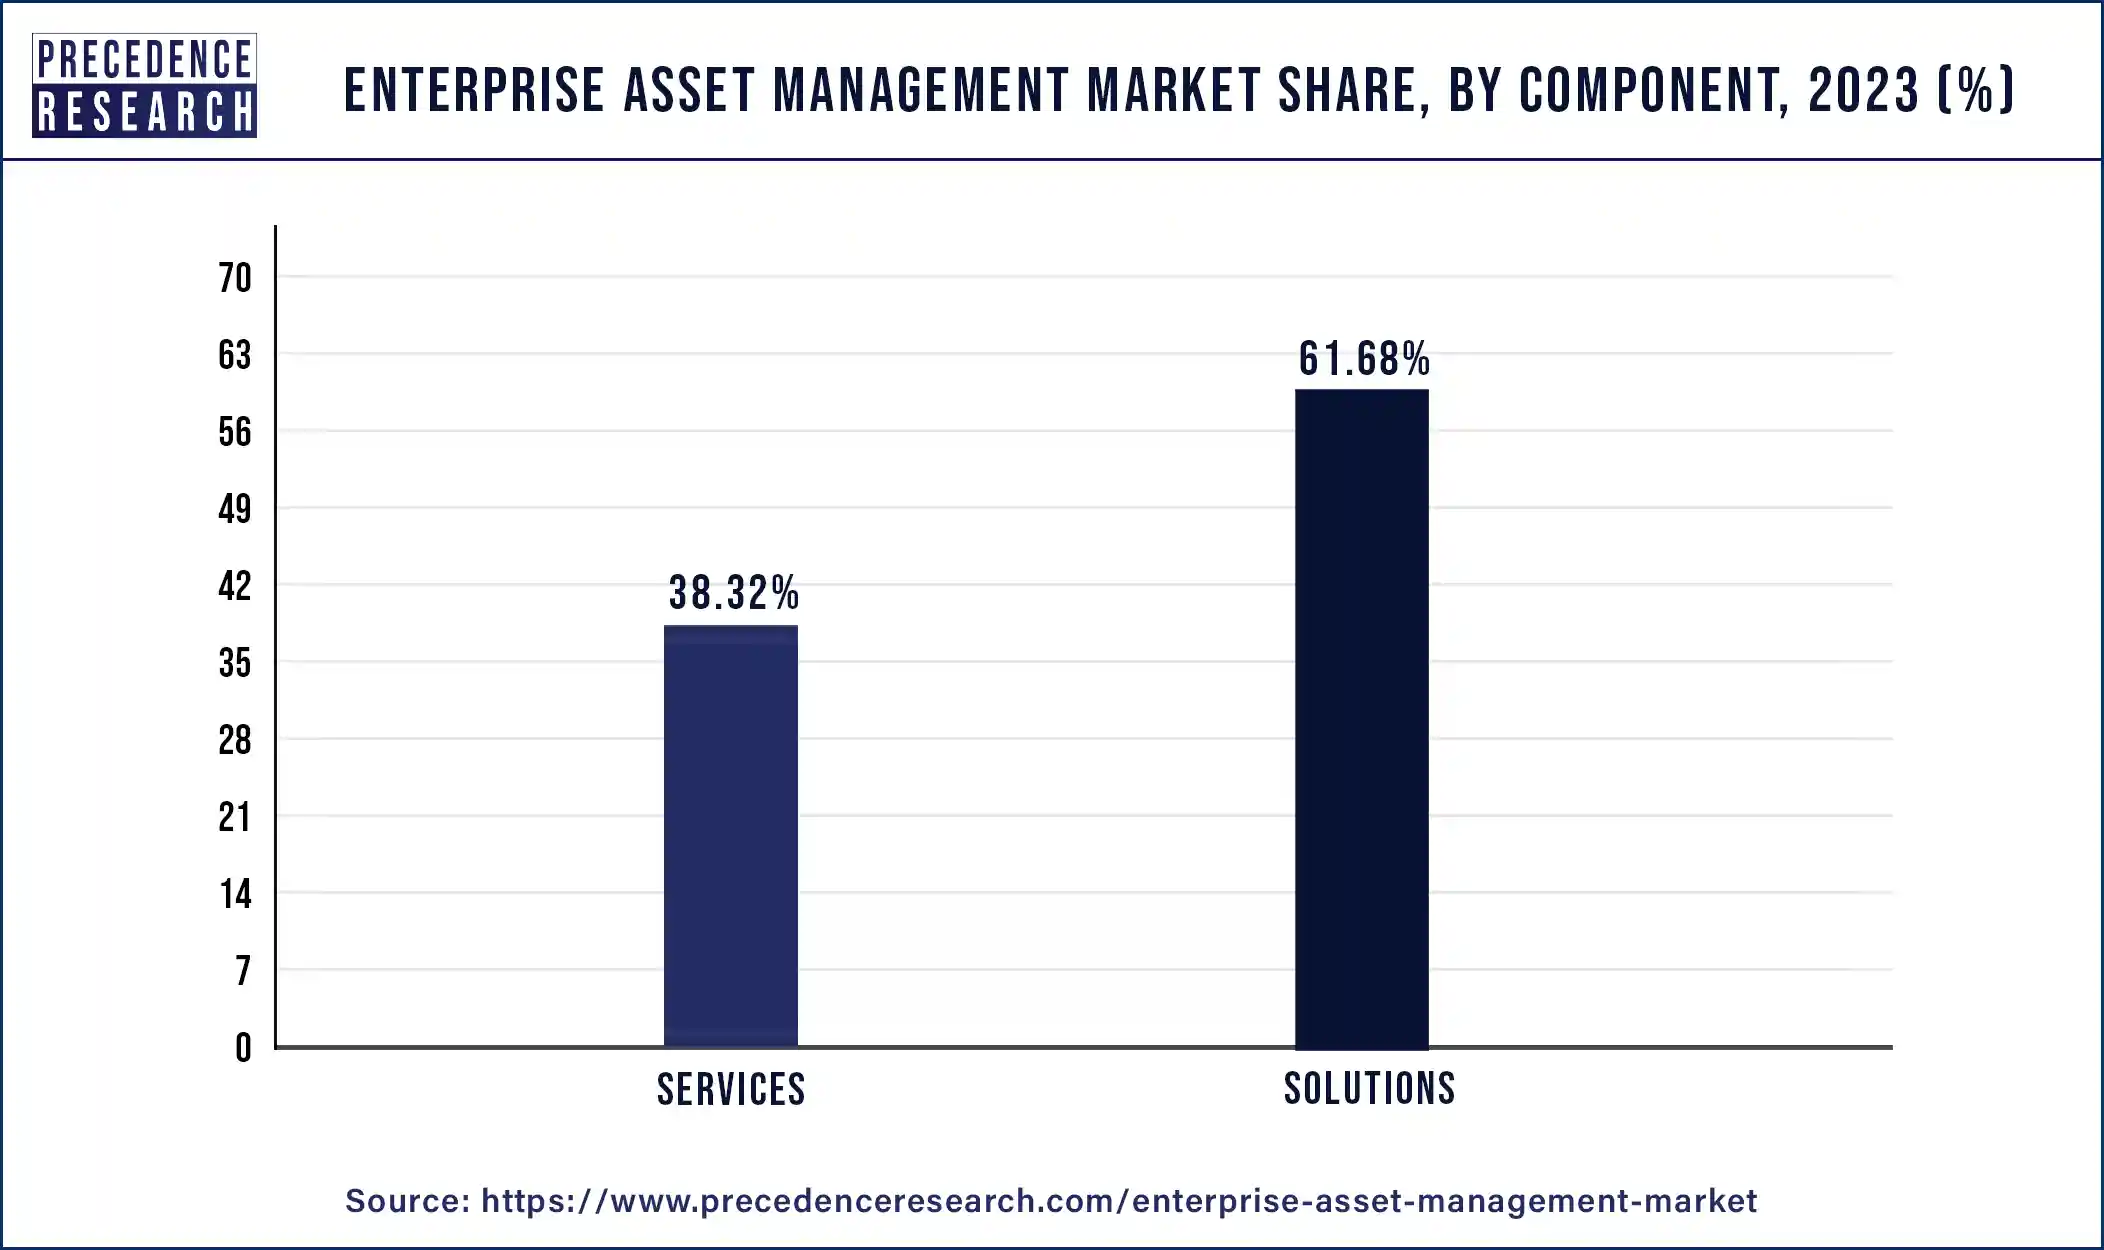
On the basis of the components, the solution segment has dominated the market in the past with the highest share in terms of revenue. As many organizations seek advanced solutions and they also want cost effective and robust systems for enterprise asset management this segment is expected to grow in the coming years. For preventing the errors in the system and to report and predict such errors the demand for enterprise asset management systems is increasing. In order to spend less amount on maintenance and to control the cost many companies are adopting the enterprise asset management systems.

Apart from the solutions segment the services segment is also expected to grow well in the coming years period it will exhibit the highest compound annual growth rate in the coming years. The need for professionals which could manage the services has grown in the recent years.
Enterprise Asset Management Market, By Component, 2020-2023 (USD Million)
| Component | 2020 | 2021 | 2022 | 2023 |
| Solutions | 2,118.94 | 2,340.60 | 2,587.31 | 2,862.10 |
| Services | 1,336.61 | 1,468.80 | 1,615.22 | 1,777.49 |
On the basis of deployment, the on-premise segment is expected to dominate the market in the coming years period security issues is one of the factors that will drive the market growth for this segment. As data security and organizational control is better with the use of on-premise solutions the demand for this segment is expected to grow in the coming years.
Enterprise Asset Management Market, By Deployment, 2020-2023 (USD Million)
| Deployment | 2020 | 2021 | 2022 | 2023 |
| Cloud-Based | 1,991.09 | 2,203.76 | 2,440.91 | 2,705.54 |
| On-Premise | 1,464.46 | 1,605.64 | 1,761.62 | 1,934.05 |
Large scale enterprises will adopt these systems to a great extent for their business. Large scale enterprises have good amount of money for investing in such systems due to which there shall be an increased adoption of these systems in these enterprises. In the underdeveloped end developing nations the enterprise asset management tools and softwares will be adopted to a great extent by the medium and small-scale businesses.
Enterprise Asset Management Market, By Organization, 2020-2023 (USD Million)
| Organization | 2020 | 2021 | 2022 | 2023 |
| Large Enterprises | 2,052.60 | 2,258.26 | 2,486.33 | 2,739.42 |
| SMEs | 1,402.95 | 1,551.14 | 1,716.20 | 1,900.18 |
On the basis of application asset lifecycle management segment will have a significant share due to an increase in the demand for the enterprise asset management softwares for this purpose. This segment has dominated the market in the past in terms of revenue. As the software's help in the planning, designing and completion of various projects that are extremely complex they will help in the growth of the market in the coming years. The maintenance and the operations of the assets are monitored through the use of this function.
The amount of errors made are reduced and the amount of time spent on all of these processes is also reduced due to the adoption of the enterprise asset management system. The inventory management segment is also expected to grow well in the coming years period it will exhibit the highest compound annual growth rate in the coming years. It provides useful information about the utilization of parts and the cost of the parts.
Enterprise Asset Management Market, By Application, 2020-2023 (USD Million)
| Applications | 2020 | 2021 | 2022 | 2023 |
| Asset Lifecycle Management | 974.47 | 1,077.47 | 1,192.23 | 1,320.18 |
| Labor Management | 358.00 | 393.08 | 431.91 | 474.92 |
| Inventory Management | 487.92 | 542.19 | 602.93 | 670.96 |
| Predictive Maintenance | 679.02 | 747.05 | 822.50 | 906.22 |
| Work Order Management | 277.83 | 306.58 | 338.56 | 374.14 |
| Others | 678.32 | 743.03 | 814.40 | 893.18 |
On the basis of the end user the utilities and energy sector are expected to have the largest market share in the coming years. The increased add option of the enterprise asset management systems in these industries will help in the growth of the market in the coming years period this segment has dominated the market in the past. In the utilities and energy industry rapid digitalization has proved to be instrumental in the growth of the enterprise asset management systems.
Industry 4.0 is one of the recent advancements that will be helpful and the growth of the market in the coming years. In order to reduce the malfunctions of the machine the demand for enterprise asset management software is expected to grow in the coming years.
Global Enterprise Asset Management Market, By End User, 2020-2023 ($Million)
| End User | 2020 | 2021 | 2022 | 2023 |
| Manufacuring | 788.56 | 870.17 | 960.94 | 1,061.93 |
| Energy & Utilities | 624.07 | 690.04 | 763.54 | 845.47 |
| Transportation | 516.26 | 573.11 | 636.68 | 707.81 |
| Oil & Gas | 363.87 | 403.14 | 446.96 | 495.91 |
| Government & Defense | 340.72 | 374.48 | 411.89 | 453.36 |
| Healthcare | 286.81 | 314.28 | 344.64 | 378.20 |
| IT & Telecom | 215.28 | 235.43 | 257.65 | 282.16 |
| Others | 319.98 | 348.75 | 380.25 | 414.74 |
Segments covered in the report
By Component
By Application
By Organization
By Deployment
By End User
By Geography
For inquiries regarding discounts, bulk purchases, or customization requests, please contact us at sales@precedenceresearch.com
No cookie-cutter, only authentic analysis – take the 1st step to become a Precedence Research client
November 2024
November 2024
November 2024
February 2025