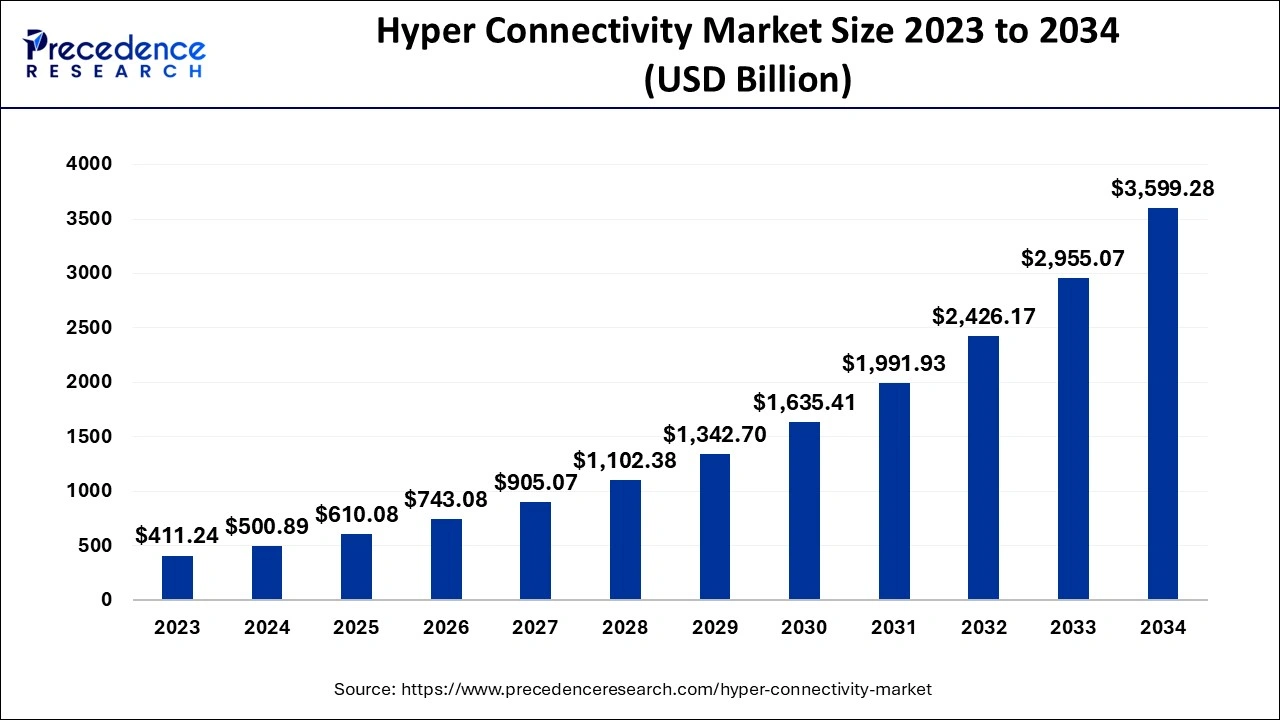
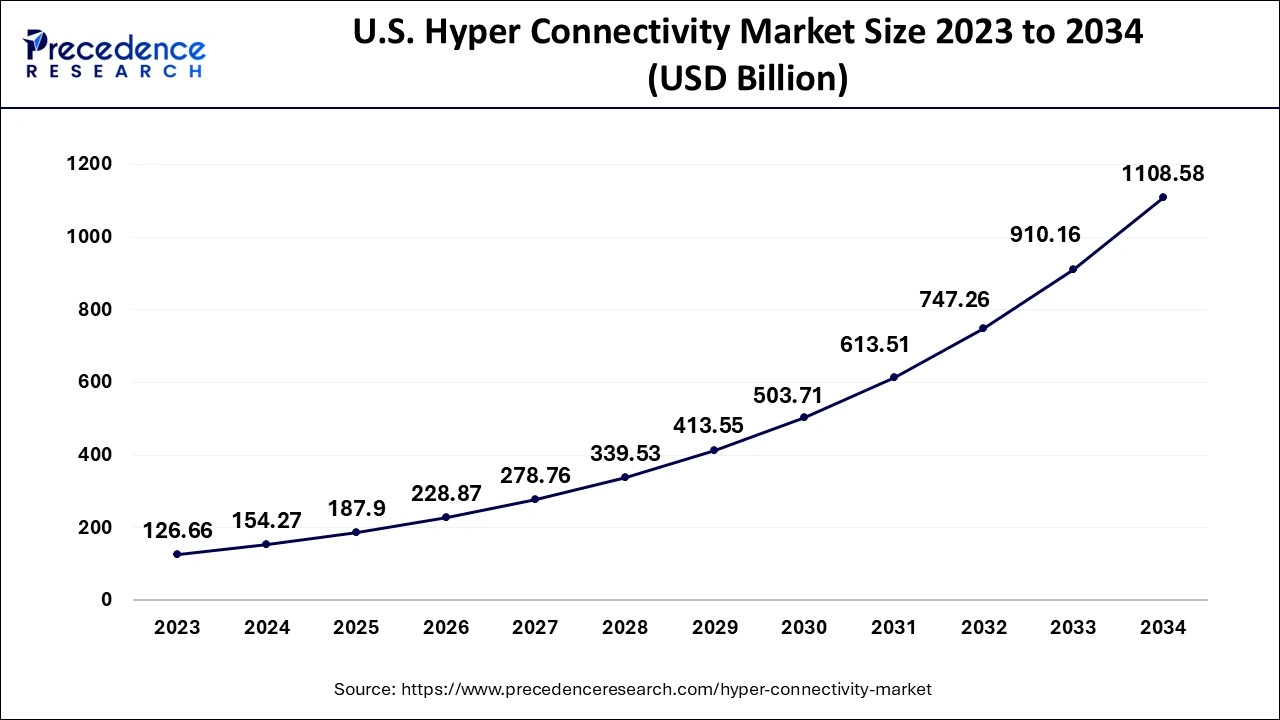
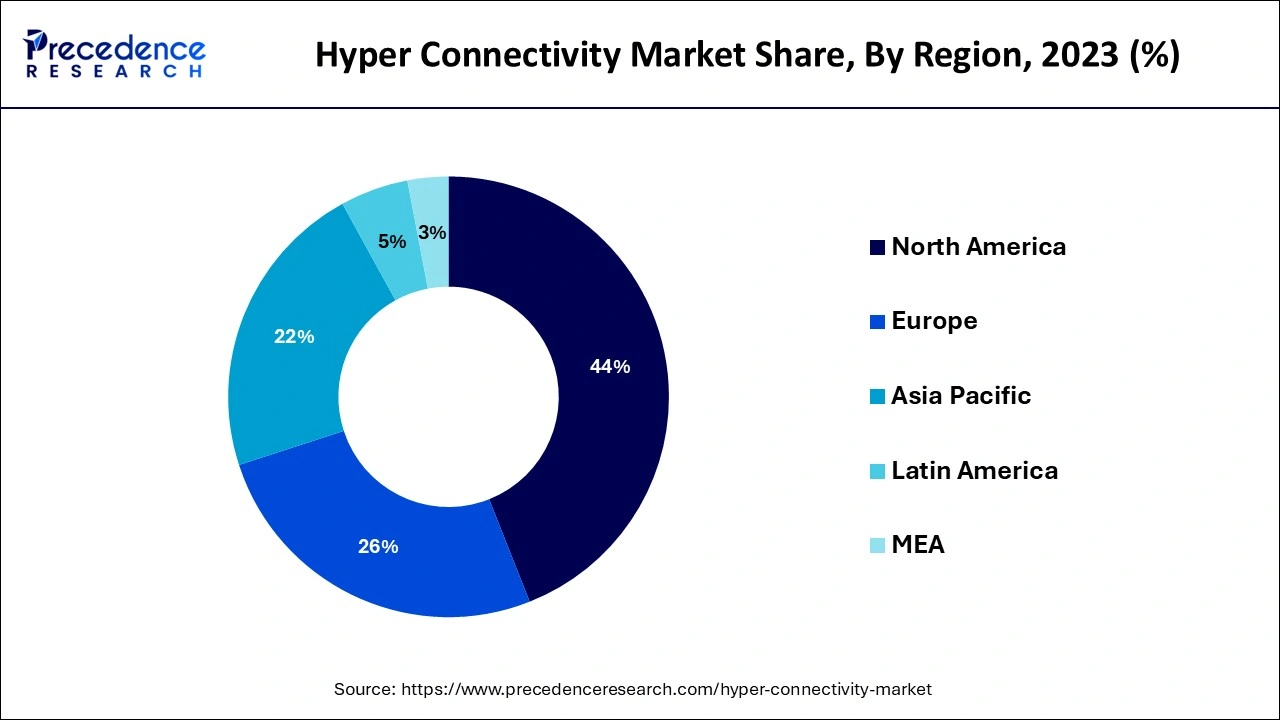
The global hyperconnectivity market size accounted for USD 500.89 billion in 2024, grew to USD 610.08 billion in 2025 and is predicted to surpass around USD 3599.28 billion by 2034, representing a healthy CAGR of 21.80% between 2024 and 2034. The North America hyperconnectivity market size is calculated at USD 220.39 billion in 2024 and is expected to grow at a fastest CAGR of 21.80% during the forecast year.
The global hyperconnectivity market size is estimated at USD 500.89 billion in 2024 and is anticipated to reach around USD 3599.28 billion by 2034, expanding at a CAGR of 21.80% from 2024 to 2034.

The U.S. hyperconnectivity market size is evaluated at USD 154.27 billion in 2024 and is predicted to be worth around USD 1108.58 billion by 2034, rising at a CAGR of 21.80% from 2024 to 2034.

North America is one of the key contributors to the global market for hyper connectivity because of its technological improvement. Because both the United States Canada are developed economies, they can invest a lot of money in R&D initiatives. Rapid industrial focus area digitalization, increased use of smart connected devices, and technological advancements have all contributed to the growth of the North American hyper connectivity industry. The primary drivers of the market's expansion in the North American region are the use of connected devices and the corresponding network infrastructure, as well as the increasing collaboration between hardware, network, and software vendors.

Smart transportation is commonly employed in the region, which helps commuters get to their destinations safely. Canadian organizations are improving and optimizing their company processes by embracing IoT capabilities. Additionally, the companies create and sell IoT technologies to assist businesses in operating more effectively. Smart citizen services are a development enabler in North America, where there are numerous well-known public health and safety organizations, including firefighting and emergency medical services. As a consequence of technology advancements, there has been a rise in the usage of smart solutions installed, which has helped the area create a safe environment that is focused on the needs of its citizens.
To maintain a connection to information and social networks while using unified communications that delivers traffic handling capacity and network bandwidth, one must employ numerous devices and systems. This is known as hyper connectivity. It makes it possible for businesses to move, exchange, and share data and information. Additionally, businesses use hyper connection to engage staff in a variety of activities including globalisation, competitive employment possibilities, new working practises, general expectations, and health and well-being. Integrating data from physical devices into the creation of new data-driven scenarios and services, such as eHealth, transportation, energy, or Internet of Things, is an advantage of hyper connection (IoT). The growing use of streaming content, sophisticated software, and network integration will be the main factors driving demand for linked living.
With over 4 billion internet users, over 5 billion mobile phone users, and 3.2 billion active social media users worldwide which are increasing at a rate of an average of 11 new users per second the globe is becoming increasingly hyperconnected in 2017. Traditional apps may be moved from users' constrained PCs to the theoretically limitless cloud thanks to computing resource virtualization. Everyone now has access to the advantages of high-performance computing through their linked gadgets. In order to increase service dependability and security as well as resource efficiency, virtualization is crucial.
One of the factors enabling a hyperconnected world is the Internet of Things (IoT). IoT is a network that links the digital and physical worlds. By 2025, there may be more than 55 billion IoT devices, up from the estimated 9 billion linked gadgets in 2017. In order to minimise technological obsolescence in a society that is highly linked without impeding on technological advancement and commerce, it is difficult to handle issues with standardisation and interoperability. The primary benefit of a hyper-connected world is the incorporation of data from physical devices into the creation of new data-driven services and scenarios, such as those in the fields of transportation, eHealth, Industry 4.0, and energy.
The expansion of the hyper connectivity market is being driven by the increase of internet connectivity, the use of smartphones, and the Internet of Things. A multiplicity of data contact points is being created by the rise of connected gadgets, giving marketers improved understanding of customer behaviour. Additionally, more firms are using hyperconnected devices since they offer a way to boost employee engagement through ongoing communication, which drives the market's expansion. Additionally, the development of 5G technology is anticipated to fuel the demand for hyperconnected devices. As gadgets become more interconnected, 5G technology lays the groundwork for frictionless data transfer between them, allowing the network of smart devices to grow even more.
| Report Coverage | Details |
| Market Size in 2024 | USD 500.89 Billion |
| Market Size by 2034 | USD 3599.28 Billion |
| Growth Rate from 2024 to 2034 | CAGR of 21.80% |
| Base Year | 2023 |
| Forecast Period | 2024 to 2034 |
| Segments Covered | Organizational Size, Component, Product, Industry Vertical, and Geography |
Lack of awareness among people about IoT and smart cities that require hyper connectivity solutions
The large scale enterprise sector led the total Hyper connectivity in 2022 based on organizational size, and this trend is anticipated to continue throughout the forecast period. This is due to a surge in IoT technology adoption by businesses seeking to acquire a strategic and competitive edge over their rivals. Customers employ hyper connection technologies to have new perspectives on big different datasets which includes recent as well as historical data. The technology is suitable for data collecting, algorithm execution, and analysis across vast data sets to unhide entities, relationships, and insights.
Additionally, as more significant businesses examine the extraction capabilities for obtaining priceless insights from big data, which is advantageous for the industry, hyper connection keeps gaining popularity. The category for small and medium-sized businesses, however, is anticipated to develop at the fastest rate. This is a result of SMEs moving their operations to digital platforms and utilising hyper connection technologies, which is assisting them in being more productive, efficient, and intelligent.
Business applications which enhance operational efficiencies, improvise customer experience, as well as provide new potential for income generation are offered by hyper connection software solutions. IoT devices that are internet-connected communicate with other connected devices, apps, and objects in a simple way to exchange information and offer the consumer with transparent data decisions. Increased connection Software solutions provide a wide range of technologies which help businesses in achieving its goals and preserving a key competitive advantage.
In order to automate various tasks at vital infrastructure, industry, and other places, software solutions are gaining popularity for the established infrastructure systems. However, several locations have stopped receiving money from new projects during the 2020–2021 term. Additionally, software solutions provide excellent asset visibility and control from a distance, enabling flexibility in dispersed settings. Therefore, over the projection period, software solutions are anticipated to have the greatest market size.
By Organizational Size
By Component
By Product
By Industry Vertical
By Geography
For inquiries regarding discounts, bulk purchases, or customization requests, please contact us at sales@precedenceresearch.com
No cookie-cutter, only authentic analysis – take the 1st step to become a Precedence Research client