Biopharmaceuticals Market Size, Key Companies, Company Product Portfolio, Patient Volume, Treatment Adoption Rates, Pricing Analysis, Regulatory Landscape, Clinical Trial Trends, Market Share, and Demand Forecast
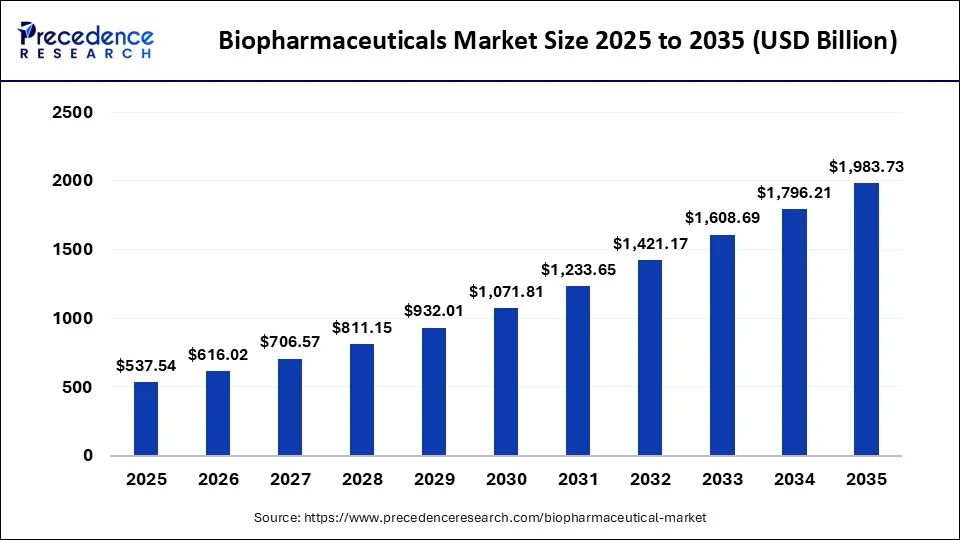
Deepa Pandey, a healthcare industry expert, highlights that the biopharmaceuticals market has reached USD 616.02 billion in 2026 and is on track to reach USD 1,983.73 billion by 2035, advancing at a CAGR of 13.95%. Key biopharmaceuticals market companies shaping the market include Roche/Genentech, AbbVie, Johnson & Johnson, while major growth segments span by type, by application and region.
Source: https://www.precedenceresearch.com/biopharmaceutical-market
 Get a Sample
 Table Of Content


What is the Biopharmaceuticals Market Size?
The global biopharmaceuticals market size is calculated at USD 537.54 billion in 2025 and is predicted to increase from USD 616.02 billion in 2026 to approximately USD 1,983.73 billion by 2035, expanding at a CAGR of 13.95% from 2026 to 2035. The growing demand for personalized medicines, burgeoning biotechnology sector, and technological advancements drive the market.
Biopharmaceuticals Market Key Takeaways
- North America dominated the global biopharmaceutical market with the highest market share of 46% in 2025.
- By type, the monoclonal antibodies segment accounted for the largest market share of 38% in 2025.
- By type, the vaccines segment is expected to witness the fastest growth during the forecast period.
- By application, the oncology segment dominated the global biopharmaceuticals market in 2025.
- By application, the cardiovascular disease segment is projected to be the fastest-growing segment over the forecast period.
Overview: A Market Transitioning from Blockbuster Biologics to Precision, Cell, and Gene-Based Modalities
The global biopharmaceuticals market, encompassing monoclonal antibodies, recombinant proteins, vaccines, cell and gene therapies, and other biologically derived therapeutics, is estimated at approximately USD 450 to 470 billion in 2025 and is projected to reach roughly USD 850 to 900 billion by 2030 to 2032, implying a compound annual growth rate in the 9 to 11% range. This places biopharmaceuticals among the fastest growing segments of the broader life sciences industry, expanding at more than twice the rate of small molecule pharmaceuticals.
North America accounts for approximately 45 to 48% of global demand, underpinned by dense biotech clustering, favorable reimbursement for specialty biologics, and the largest concentration of approved cell and gene therapies. Monoclonal antibodies remain the single largest product category, representing roughly one third to two fifths of total market revenue, while oncology stands as the leading therapeutic application. Cell and gene therapies, though still a small share of total revenue (estimated in the mid single digits as a percentage of the market), represent the fastest growing category, with growth rates in the high single to low double digits as approvals expand beyond rare and ultra rare indications into broader oncology and hematology.
Market concentration is moderate to high at the revenue level; a small number of global biologics leaders account for a disproportionate share of branded revenue, but the innovation base is highly fragmented, with thousands of clinical stage biotech companies feeding pipeline and licensing activity. The industry is best characterized as maturing in its legacy antibody and recombinant protein categories while entering a high growth phase in cell, gene, and RNA based modalities.
Key Coverage
- Global and regional market sizing, 2021 to 2032
- Product type, modality, and therapeutic application segmentation
- Biologics pricing and reimbursement dynamics by region
- Manufacturing capacity and bioprocessing supply demand balance
- Patent cliff and biosimilar erosion analysis
- Competitive benchmarking across 20 to 25 leading biopharmaceutical companies
Market Size & Forecast: Biologics Are Capturing a Rising Share of Total Pharmaceutical Revenue
Biopharmaceuticals represented an estimated USD 410 to 430 billion in 2024, growing to an estimated USD 450 to 470 billion in 2025. Under a base case scenario, the market is forecast to reach approximately USD 850 to 900 billion by the early 2030s, a CAGR of roughly 9 to 10%. Upside scenarios, driven by accelerated cell and gene therapy approvals and expanded oncology indications for existing antibody franchises, point to CAGRs approaching 12 to 14% and a market size exceeding USD 1 trillion by 2032 to 2034. A downside scenario incorporating faster than expected biosimilar substitution and pricing reform in major markets suggests growth could moderate to the 6 to 7% range.
Biologics now account for an estimated 35 to 40% of total global pharmaceutical revenue, up from roughly a quarter a decade ago, despite representing a much smaller share of total prescription volume, reflecting the premium pricing biologics command relative to small molecule drugs. Regionally, North America contributes the largest incremental revenue pool through 2030, but Asia Pacific is forecast to be the fastest growing region, with a CAGR in the low to mid teens, driven by expanding biomanufacturing capacity, rising biosimilar production, and growing domestic biotech pipelines in China, South Korea, and India.
Key Coverage
- Historical (2021 to 2024) and current (2025) market size by value
- Base, upside, and downside forecasts to 2030 to 2034
- Regional revenue contribution and incremental opportunity by geography
- Biologics share of total pharmaceutical spending over time
Segmentation Analysis
By Product Type / Modality
Monoclonal antibodies represent the largest segment, at an estimated 35 to 40% of market revenue, valued at roughly USD 160 to 185 billion in 2025. Growth is estimated at a CAGR of 7 to 9%, slower than the market average as the category matures and faces biosimilar competition, but still the largest absolute contributor to incremental revenue given its scale. Sub segments include conventional IgG antibodies (the majority of category revenue), bispecific and multispecific antibodies (the fastest growing sub segment within the category, estimated CAGR of 15 to 20%), and antibody drug conjugates, which have moved from a niche category to an estimated USD 15 to 20 billion segment within five years of broader oncology adoption.
Recombinant proteins and hormones account for an estimated 15 to 18% of revenue, roughly USD 70 to 85 billion in 2025, including insulin analogs, growth hormones, clotting factors, and cytokines. This segment shows the slowest growth of the major categories, estimated at a CAGR of 4 to 6%, reflecting biosimilar penetration exceeding 60 to 80% of unit volume in several mature markets for categories such as insulin and anti-TNF proteins.
Vaccines represent approximately 13 to 15% of revenue, an estimated USD 60 to 70 billion in 2025, spanning traditional recombinant and conjugate vaccines as well as the newer mRNA platform. Growth has normalized to an estimated 4 to 6% CAGR following the post-pandemic demand correction, though mRNA-based vaccine platforms are expanding into new indications, including respiratory syncytial virus and personalized cancer vaccines, at a materially faster rate than the category average.
Cell and gene therapies comprise an estimated 5 to 8% of total market revenue, roughly USD 25 to 35 billion in 2025, but are the fastest growing product category, with an estimated CAGR of 18 to 24% through 2030. Sub segments include CAR-T and other engineered cell therapies (the largest commercial sub segment to date), in vivo and ex vivo gene therapies for monogenic and rare diseases, and emerging allogeneic, "off the shelf" cell therapy platforms, which are earlier stage but expected to expand access by removing patient-specific manufacturing constraints.
Other biologics, including blood and plasma-derived products, allergenics, and biosimilars as a distinct commercial category, account for the remaining share of the market, estimated at roughly 20 to 25% combined.
By Therapeutic Application
Oncology is the single largest end-use category, accounting for an estimated 30 to 35% of biopharmaceutical revenue and growing at a CAGR of roughly 11 to 13%, ahead of the overall market average, driven by antibody drug conjugates, bispecific antibodies, checkpoint inhibitors, and CAR-T expansion into earlier treatment lines.
Autoimmune and inflammatory disease represents an estimated 15 to 18% of revenue. Growth here is more moderate, estimated at 5 to 7% CAGR, as this is the category most exposed to biosimilar substitution for anti-TNF and interleukin-targeted therapies.
Infectious disease and vaccines account for approximately 12 to 15% of revenue, with growth normalizing after pandemic-era volatility to an estimated 4 to 6% CAGR, though this masks faster growth in next-generation vaccine platforms.
Metabolic and endocrine disease (including diabetes and, increasingly, obesity-related biologics) represents an estimated 10 to 12% of revenue and is one of the fastest-growing application areas at the aggregate level, with GLP-1 and related biologic therapies expanding the addressable patient population substantially beyond the historical diabetes-only base.
Rare and orphan diseases, while individually representing a smaller share of aggregate revenue (estimated 8 to 10%), constitute a disproportionately high-value segment given premium per-patient pricing frequently exceeding USD 100,000 to 500,000 annually for advanced cell and gene therapies, and this category is expected to grow at close to the fastest rate of any application segment through 2030.
Neurology, including biologics for migraine, multiple sclerosis, and emerging Alzheimer's disease-modifying antibodies, represents an estimated 6 to 8% of revenue and is positioned as an emerging high-growth category pending continued commercial uptake of recently approved amyloid-targeting therapies.
By Manufacturing Modality
Mammalian cell culture, particularly CHO-cell platforms, remains the dominant production technology for antibodies and recombinant proteins, underpinning an estimated 60% or more of total biologics manufacturing volume. Microbial fermentation remains relevant for simpler recombinant proteins and certain vaccine antigens. Viral vector and mRNA-based manufacturing platforms are the fastest-expanding production categories in percentage terms, reflecting the shift toward gene therapy and next-generation vaccine modalities, though they remain a small share of total manufacturing volume given lower per-batch output relative to established platforms.
By Geography
North America leads with an estimated 45 to 48% share of global revenue, followed by Europe at approximately 22 to 25%, and Asia Pacific at approximately 18 to 20%, though Asia Pacific is forecast to be the fastest-growing region through 2030. Latin America and the Middle East and Africa together represent the remaining share, estimated at roughly 8 to 10% combined, with growth concentrated in vaccine and biosimilar categories rather than advanced modalities.
What is the U.S. Biopharmaceuticals Market Size?
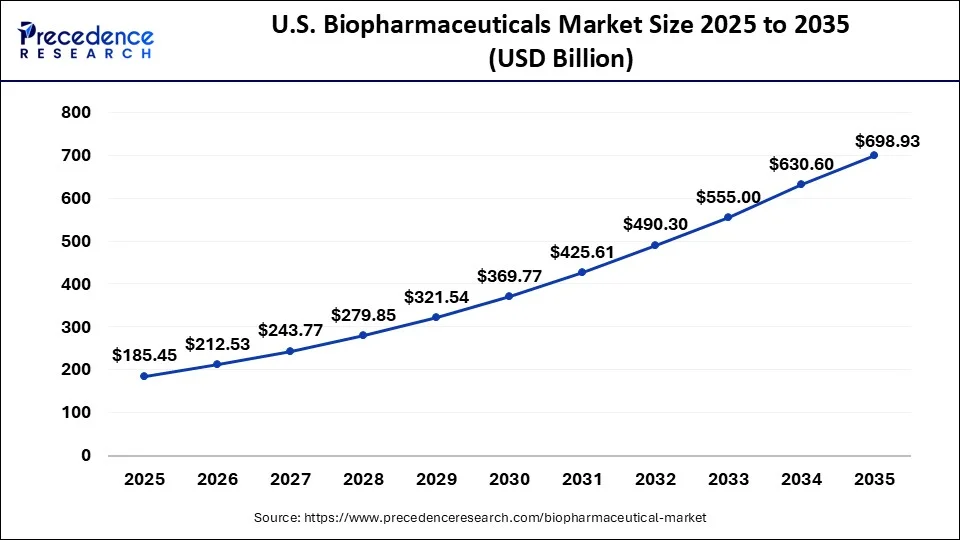
The U.S. biopharmaceuticals market size was evaluated at USD 185.45 billion in 2025 and is predicted to be worth around USD 698.93 billion by 2035, rising at a CAGR of 14.19% from 2026 to 2035.
Segment Summary
- Largest segment by revenue - monoclonal antibodies
- Fastest-growing segment - cell and gene therapies
- Highest per-unit value segment - gene therapies (per-treatment pricing)
- Emerging segment - bispecific antibodies, mRNA therapeutics, allogeneic cell therapy
- Segment under structural pressure - recombinant proteins and legacy antibodies facing biosimilar erosion
Which Forces Will Determine Whether Biopharmaceutical Growth Accelerates or Plateaus Through 2030?
Three forces are currently in tension within the biopharmaceuticals market, namely an expanding approval base, a wave of exclusivity loss, and a set of structural growth pockets still under-penetrated. Regulatory agencies across major markets are approving novel biologics at a materially higher rate than a decade ago, and antibody drug conjugates and bispecific antibodies have moved from niche to mainstream oncology treatment paradigms within the past three years alone, a pace of clinical trial adoption that is fast even by biologics standards. At the same time, several major biologic franchises face loss of exclusivity this decade, with cumulative revenue exposure estimated in the tens of billions of dollars annually. In mature biosimilar categories, penetration has already reached 60 to 80% of unit volume within a few years of entry, establishing a clear precedent for how quickly originator pricing erodes once competition arrives.
Our analysis indicates that these two forces are not offsetting in a simple net fashion; they are reshaping where growth comes from rather than how much growth occurs in aggregate. The franchises most exposed to biosimilar erosion tend to sit in mature, high-volume categories (recombinant proteins, first-generation antibodies) where clinical differentiation has narrowed over time, while the fastest-growing pipeline activity, ADCs, bispecifics, and cell and gene therapies, is concentrated in categories where clinical differentiation remains high and biosimilar substitution is not yet a near-term threat. In our view, this divergence means aggregate market growth figures understate the scale of the underlying reallocation; revenue is shifting away from companies and products that built through-cycle scale on legacy modalities, toward those with pipeline exposure to next-generation formats.
We believe the more consequential strategic implication is on the supply side rather than the demand side. Manufacturing platforms for advanced therapies, particularly viral vector and patient-specific cell processing, currently carry production costs substantially above traditional biologics, and this cost gap is the binding constraint on how quickly opportunities such as earlier-line oncology expansion and cell/gene therapy access beyond the United States and Western Europe can be realized. From our assessment, this creates a near-term opportunity for companies and capital that can address manufacturing cost of goods specifically, since clinical and regulatory pathways for these therapies are, in several cases, already ahead of the manufacturing base's ability to support broader access.
The full report quantifies this dynamic at a more granular level, mapping exclusivity timelines against specific franchise revenue exposure, tracking biosimilar entry and penetration curves by molecule and geography, and sizing the manufacturing cost curve for advanced modalities against the pace of indication expansion.
The intelligence supporting this analysis can also be structured into a granular tracking database that covers individual biologic franchises by exclusivity date, biosimilar entrants and approval status across markets, molecule- and geography-level penetration curves, and pipeline programs by modality, development phase, and indication. At this level of detail, the dataset can be filtered by company, therapeutic area, region, or modality and benchmarked over time, enabling clients to monitor exclusivity risk and pipeline-driven growth exposure on a rolling basis rather than through a static snapshot. This complements the strategic narrative by providing a live, queryable view of the underlying market shifts.
Is Biologics Pricing Structurally Shifting Toward a One-Time, High-Value Payment Model, and What Does That Mean for Margin?
Pricing across the biopharmaceuticals market now spans two fundamentally different models rather than a single continuum. Established monoclonal antibodies carry annual treatment costs of USD 20,000 to 100,000, priced as ongoing therapy, while advanced cell and gene therapies are increasingly priced as one-time treatments ranging from USD 300,000 to over USD 3 million, reflecting curative or near-curative positioning. This pricing divergence is mirrored in cost structure rather than offset by it; gross margins for mature biologics franchises typically run 75 to 85%, among the highest in the pharmaceutical industry, while early-stage cell and gene therapy programs often operate below 30% margin, a gap that has not closed even as manufacturing cost per gram for monoclonal antibodies has fallen an estimated 40 to 50% over the past decade through platform standardization.
Our analysis indicates that this is not a temporary pricing anomaly but a structural characteristic of how these modalities are manufactured and commercialized. Antibody margin expansion has been driven by platform standardization and single-use bioprocessing, with much of these efficiencies realized once production reaches scale. Cell and gene therapies have yet to achieve a comparable level of standardization. Viral-vector production remains a key bottleneck, limiting margins because patient-specific and vector-dependent manufacturing has not followed the same cost-reduction trajectory as antibody platforms.
In our view, the most significant implication is that gene therapy pricing of USD 300,000 to 3 million reflects cost recovery within an immature manufacturing base as much as it reflects clinical value. Consequently, margin improvement is more likely to come from innovation in vector manufacturing than from further price increases.
We believe regional pricing divergence reinforces this dynamic rather than operating independently. US list prices are 2 to 3 times higher than European prices and 4 to 6 times higher than those in several Asia-Pacific markets. As the United States represents the largest market for these therapies, its reimbursement environment plays a significant role in supporting the economics that enable margin recovery for high-cost modalities globally.
From our assessment, this concentration of pricing power creates meaningful exposure. US pricing reform initiatives targeting high-cost biologics could affect not only originator revenues in the US market but also the pace of manufacturing cost reduction for advanced modalities, as the scale economics of these platforms are currently supported to a significant extent by US pricing levels.
The full report provides modality-level pricing benchmarks by indication, margin trajectories segmented by manufacturing maturity, and a country-level reimbursement comparison isolating where pricing power is most exposed to near-term policy change.
This intelligence can also be developed into a granular pricing and margin database that tracks individual products by modality, indication, list price, geography, reimbursement status, and estimated gross margin over time. The dataset can be filtered by geography, modality, or manufacturing stage and benchmarked against exclusivity and biosimilar-entry timelines. This provides clients with a live view of pricing and margin trends, highlighting where these metrics are converging or diverging as advanced therapy manufacturing scales.
Key Coverage
- Product and modality-level annual treatment cost benchmarks
- Gross margin ranges by modality and manufacturing maturity
- Regional price differentials and reimbursement structure comparison
- Manufacturing cost curve trends for antibody and viral-vector platforms
Where Does Biomanufacturing Capacity Genuinely Constrain Growth, and Where Is That Narrative Overstated?
The capacity picture in biopharmaceuticals is bifurcated by modality rather than uniformly tight. Installed bioreactor capacity for monoclonal antibodies has grown at a mid-single-digit annual rate over the past five years. Global utilization is estimated at 65 to 75%, indicating adequate rather than constrained capacity for established modalities. Viral-vector manufacturing tells a different story. Contract manufacturing lead times have historically extended 12 to 24 months, a gap wide enough to directly limit how quickly cell and gene therapy developers can move from clinical to commercial supply.
Our analysis suggests that the capacity constraints often associated with biologics are concentrated in viral-vector and advanced-therapy manufacturing rather than being representative of the industry as a whole. Antibody manufacturing capacity has generally expanded in line with or ahead of demand, with utilization remaining below full capacity. By contrast, newer manufacturing segments involving lower volumes and greater process complexity continue to face tighter capacity conditions, as capital investment and process standardization have not kept pace with the growth in clinical programs and regulatory approvals.
We believe the more structurally significant shift is geographic rather than purely a vector-capacity story. Asia Pacific, and China specifically, has expanded its share of global biomanufacturing capacity through substantial capital investment in large-scale bioreactor facilities and growing biosimilar production capability, narrowing what was historically a wide gap with North America and Europe. From our assessment, this creates a dual opportunity and risk for incumbents; it expands the addressable global supply base for established modalities, which should ease any residual antibody capacity risk further, but it also signals that the next wave of capacity investment, and the manufacturing cost advantage that comes with it, may increasingly originate outside the traditional North America and Europe manufacturing base.
The full report quantifies installed and planned bioreactor capacity by region and facility scale, tracks contract manufacturing lead times specifically for viral-vector and cell-therapy production, and maps capacity utilization trends against demand forecasts by modality through 2030.
The same intelligence can also be structured as a granular facility-level database, tracking individual manufacturing sites by company, region, modality (mammalian cell culture, viral vector, cell therapy), installed capacity, utilization, and planned capacity additions with expected online dates. At this level of granularity, the dataset can be filtered by geography, modality or company and benchmarked against demand forecasts, giving clients a live view of where genuine capacity risk is concentrated rather than relying on aggregate industry-wide utilization figures.
Value Chain & Supply Chain: Manufacturing and Distribution Complexity Concentrates Value in Process Development and Specialty Logistics
The biopharmaceutical value chain spans raw material and cell-line/media suppliers, contract development and manufacturing organizations, originator biologics developers, specialty distribution and cold-chain logistics providers, and healthcare providers and payers. Unlike small-molecule pharmaceuticals, biologics require continuous cold-chain integrity from manufacturing through administration, and advanced cell therapies require patient-specific chain-of-custody logistics, adding substantial cost and complexity relative to conventional drug distribution.
Value capture is concentrated disproportionately in upstream process development and cell-line engineering, where proprietary platform technology creates durable competitive advantage, and in commercial-stage manufacturing scale, which drives the majority of gross margin realization. Contract development and manufacturing organizations have captured a growing share of industry value as originator companies increasingly outsource specialized production, particularly for viral-vector and cell-therapy manufacturing where in-house capability requires substantial capital investment.
Which Emerging Technology Platforms Are Genuinely Commercially Significant, Versus Simply Well-Funded?
Pipeline composition, not funding announcements, is the clearest signal of where biopharmaceutical innovation is concentrating. Antibody drug conjugates, bispecific and multispecific antibodies, mRNA therapeutics, CRISPR-based gene editing, and cell therapy platforms, spanning CAR-T, TCR-based, and increasingly allogeneic "off the shelf" approaches, collectively now represent the largest share of new clinical pipeline activity entering the market, ahead of traditional monoclonal antibody programs. Patent filing activity in gene-editing and cell-therapy categories has grown at a substantially faster rate than filings in traditional antibody technology over the past five years.
Our analysis indicates that pipeline share and patent-filing growth provide stronger signals of commercial significance than platform novelty alone. Technologies attracting a large share of new clinical entrants and a disproportionate level of patent activity indicate that multiple independent developers are converging on the same opportunity. This provides a stronger indication of durable commercial relevance than any individual company announcement.
On this basis, gene editing and cell therapy stand out not because they are the newest technologies, but because the pace of IP formation around them is outpacing the antibody category, which continues to generate the majority of current market revenue.
We believe the emergence of AI-enabled drug discovery as a distinct layer within this shift is also notable, though its impact is structural rather than yet visible in pipeline volume. The growing number of strategic partnerships and licensing agreements between AI-native discovery companies and established biologics developers suggests that incumbents are treating AI-driven target and antibody identification as a capability gap to close through partnership rather than in-house build, which from our assessment creates a continuing opportunity for AI-native companies to capture value through licensing and collaboration structures rather than needing to compete as full-stack drug developers.
The full report tracks pipeline composition by modality and clinical phase, quantifies patent filing trends by technology category and geography, and maps the landscape of AI-biologics partnerships by deal structure and therapeutic focus.
The same intelligence can also be structured as a granular technology-tracking database, covering individual pipeline programs by modality, phase, indication and originating company, alongside patent filing counts by technology category and year, and AI-biologics partnership records by structure and therapeutic area. At this level of granularity, the dataset can be filtered by modality, geography or company and benchmarked over time, giving clients an ongoing view of where innovation intensity is shifting rather than a static snapshot of current pipeline composition.
Is Faster Regulatory Approval Actually Translating Into Faster Market Access, or Is Reimbursement Becoming the New Bottleneck?
Regulatory and commercial timelines are moving in opposite directions for high-cost biologics. Regulatory agencies across major markets have expanded accelerated and breakthrough designation pathways for serious and rare conditions, materially compressing average time-to-approval for qualifying programs relative to a decade ago. At the same time, pricing and reimbursement scrutiny has intensified, particularly for ultra-high-cost cell and gene therapies, and this has prompted growth in outcomes-based and installment payment models specifically designed to manage payer budget impact for one-time curative therapies.
Our analysis indicates that regulatory approval is no longer the primary gating factor for market access in this segment; reimbursement negotiation is. The rise of outcomes-based and installment payment structures reflects this shift. Payers would not need novel payment mechanisms if standard reimbursement processes were sufficient to accommodate one-time, multimillion-dollar treatments at approval speed. In our view, the most significant implication is that the effective time-to-patient for advanced therapies is increasingly determined by how quickly a developer can negotiate payer-specific outcomes agreements, not by how quickly a regulator can approve the product, which shifts commercial risk further downstream in the launch process than it has historically sat.
We believe this creates a clear capability differentiator among developers. Companies with established payer relationships and experience structuring outcomes-based contracts are better positioned to translate accelerated approvals into commercial uptake. By contrast, companies without this infrastructure may face a widening gap between regulatory approval and meaningful revenue recognition, even when they achieve faster regulatory timelines.
From our assessment, this creates an opportunity for developers to build reimbursement and health-economics capability in parallel with clinical development, rather than sequentially after approval, particularly as more one-time curative therapies enter the pipeline behind current approvals.
On the sustainability dimension, single-use bioprocessing technology is reducing water and energy intensity relative to legacy stainless-steel manufacturing. Our analysis suggests that this is becoming a genuine factor in manufacturing site selection and capital allocation, rather than a peripheral ESG consideration. However, single-use plastic waste remains an unresolved challenge industry-wide, and we believe this represents a live risk area; as single-use adoption scales, it may draw the same kind of regulatory and public scrutiny currently directed at biologics pricing, particularly in markets with more stringent plastic-waste and circular-economy requirements.
The full report tracks accelerated approval designations and average time-to-approval by region and therapeutic category, maps outcomes-based and installment payment agreements by developer and payer market, and benchmarks manufacturing site sustainability profiles against capital investment decisions.
Customer & Application Analysis: Specialty and Hospital Channels Dominate Advanced Biologic Distribution
Oncology, autoimmune and inflammatory disease, and rare and orphan disease together represent most of the high-value biologic demand. Distribution is concentrated through specialty pharmacy and hospital-administered channels rather than traditional retail pharmacy, reflecting the complexity of cold-chain handling and clinical administration requirements for most biologics. Payer and health system customer concentration is relatively high for advanced cell and gene therapies, which are frequently administered only at a limited number of certified treatment centers globally, creating meaningful geographic access disparities even in developed healthcare markets.
Competitive Landscape: Diversified Global Biologics Leaders Compete Alongside Specialized Cell and Gene Therapy Innovators
The competitive structure of the biopharmaceuticals market is bifurcated. A cohort of large, diversified biologics developers with broad oncology, immunology, and vaccine portfolios captures the majority of market revenue, supported by extensive commercial infrastructure and manufacturing scale. Alongside this group, a rapidly growing cohort of specialized cell, gene, and RNA therapy companies, many of which remain in the early commercial stages, is driving a disproportionate share of pipeline innovation and future growth. However, these companies do not yet account for a comparable share of total revenue.
Market concentration at the revenue level is moderate to high, with the leading 10 companies estimated to account for roughly 45 to 55% of total branded biologics revenue, while the remainder of the market is highly fragmented across hundreds of clinical- and commercial-stage biotechnology companies, biosimilar manufacturers, and regional specialists.
Leading Companies: Tentative Leading Company Universe
The following tentative universe of 20 to 25 companies reflects global scale leaders, biologics specialists, and emerging cell/gene therapy innovators shaping the market. Rankings are illustrative and not directly validated.
| Company |
Headquarters
|
Market Position
|
Core Strength
|
|
| 1 | Roche/Genentech |
Switzerland
|
Global leader
|
Oncology biologics, diagnostics integration
|
| 2 | AbbVie |
United States
|
Global leader
|
Immunology franchise, ADC pipeline
|
| 3 | Johnson & Johnson |
United States
|
Global leader
|
Broad immunology/oncology portfolio
|
| 4 | Pfizer |
United States
|
Global leader
|
Vaccines, oncology biologics
|
| 5 | Novartis |
Switzerland
|
Global leader
|
Gene therapy, radioligand therapy
|
| 6 | Merck & Co. |
United States
|
Global leader
|
Immuno-oncology (checkpoint inhibitors)
|
| 7 | Bristol-Myers Squibb |
United States
|
Global leader
|
Immuno-oncology, cell therapy
|
| 8 | Amgen |
United States
|
Global leader
|
Biosimilars, inflammation, oncology
|
| 9 | Sanofi |
France
|
Global leader
|
Immunology, vaccines
|
| 10 | AstraZeneca |
United Kingdom
|
Global leader
|
Oncology, biologics pipeline breadth
|
| 11 | Eli Lilly |
United States
|
Growth leader
|
Diabetes/obesity biologics, immunology expansion
|
| 12 | GSK |
United Kingdom
|
Global leader
|
Vaccines, specialty biologics
|
| 13 | Novo Nordisk |
Denmark
|
Specialist leader
|
Metabolic disease biologics
|
| 14 | Biogen |
United States
|
Specialist leader
|
Neurology biologics
|
| 15 | Regeneron |
United States
|
Technology leader
|
Antibody discovery platform
|
| 16 | Vertex Pharmaceuticals |
United States
|
Specialist leader
|
Gene editing/cell therapy (CF, sickle cell)
|
| 17 | Gilead Sciences (Kite) |
United States
|
Specialist leader
|
CAR-T cell therapy
|
| 18 | Moderna |
United States
|
Technology leader
|
mRNA platform
|
| 19 | BioNTech |
Germany
|
Technology leader
|
mRNA platform, oncology pipeline
|
| 20 | CSL Behring |
Australia
|
Specialist leader
|
Plasma-derived and recombinant biologics
|
| 21 | Takeda |
Japan
|
Regional/global leader
|
Rare disease, plasma biologics
|
| 22 | Bluebird Bio |
United States
|
Emerging challenger
|
Gene therapy specialist
|
| 23 | Legend Biotech |
China/US
|
Emerging challenger
|
CAR-T cell therapy
|
| 24 | Samsung Biologics |
South Korea
|
Manufacturing specialist
|
Biologics CDMO scale
|
| 25 | WuXi Biologics |
China
|
Manufacturing specialist
|
Biologics CDMO, Asia Pacific footprint
|
Market Share, Benchmarking, Strategic Developments & M&A
Market share among the top 10 companies is estimated to range individually from roughly 3 to 8% of branded biologics revenue, with no single company holding a dominant share exceeding approximately 10%, reflecting a moderately concentrated but not monopolistic structure. Competitive benchmarking across revenue growth, pipeline breadth, manufacturing scale, and geographic reach indicates that companies with integrated cell/gene therapy platforms and strong immuno-oncology franchises are best positioned for above-market growth through 2030, while companies with revenue concentrated in biologics facing near-term patent expiry face the greatest earnings pressure.
Strategic activity over the past two to three years has been dominated by large-scale acquisitions of cell and gene therapy and antibody-drug conjugate developers by diversified biologics leaders seeking to replenish pipelines ahead of patent cliffs. This has been accompanied by continued expansion of biomanufacturing capacity, particularly viral-vector and large-scale mammalian cell culture facilities, across North America, Europe, and increasingly Asia Pacific. M&A deal values in this space have frequently ranged from several billion to over USD 10 billion for platform-defining acquisitions, reflecting the strategic premium placed on next-generation modality access.
Opportunity & White-Space Analysis, Market Attractiveness, and Future Outlook
The largest quantifiable white-space opportunities lie in expanding cell and gene therapy access beyond current treatment-center concentration, biosimilar penetration in markets outside the United States and Europe where uptake remains comparatively low, and earlier-line oncology indication expansion for approved antibody and ADC franchises. The market is assessed as highly attractive overall given above-average growth and margin profile, tempered by high entry barriers (manufacturing capital intensity, regulatory complexity) and rising pricing scrutiny in the largest single market.
By 2030 to 2032, base-case projections point to a market approaching USD 900 billion, with cell and gene therapies and bispecific/multispecific antibodies representing the fastest-growing sub-segments, and Asia Pacific narrowing the regional growth gap with North America.
Recent Developments
- In August 2025, Oxford Nanopore Technologies and VirtuSure launched the first Good Laboratory Practice (GLP) validated adventitious viral agent (AVA) detection test using nanopore-based sequencing technology. (Source: https://www.businesswire.com)
- In July 2025, Inmagene Biopharmaceuticals completed its merger with Ikena Oncology, forming ImageneBio, Inc., a clinical-stage biotechnology company focused on developing disease-modifying treatments for immunological/autoimmune and inflammatory diseases. (Source: https://www.globenewswire.com)
- In August 2024, Biopharma Technology LLC. the dedicated United States division of Biopharma Group, announced the strategic partnership with Arete Biosciences to offer enhanced CDMO services in the USA. This collaboration establishes a dedicated R&D analysis and small batch manufacturing laboratory in the USA, specifically catering to the needs of American customers.
- In October 2024, Lonza, a global manufacturing partner to the pharmaceutical, biotech, and nutraceutical markets, announced a long-term extension of its collaboration with a major global biopharmaceutical partner for commercial-scale manufacture of ADCs. The extended agreement will expand the dedicated bioconjugation footprint for the customer through the construction of a new bioconjugation suite at Lonza's Ibex Biopark in Visp (CH). In addition, Lonza will provide commercial-scale monoclonal antibody (mAb) manufacturing services for a new ADC therapy.
- In September 2024, GENFIT, a late-stage biopharmaceutical company dedicated to improving the lives of patients with rare and life-threatening liver diseases, announced that the European Commission has conditionally approved Iqirvo1 (elafibranor) 80mg tablets for the treatment of Primary Biliary Cholangitis (PBC) in combination with ursodeoxycholic acid (UDCA) in adults with an inadequate response to UDCA or as a monotherapy in patients unable to tolerate UDCA.
Biopharmaceuticals Market Segments Covered in the Report
By Type
- Monoclonal Antibodies
- Insulin
- Vaccine
- Hormone
- Interferon
- Erythropoietin
- Growth & Coagulation Factor
- Others
By Application
- Blood Disorder
- Oncology
- Infectious Disease
- Neurological Disease
- Cardiovascular Disease
- Metabolic Disease
- Immunology
- Others
By Region
- North America
- Europe
- Asia-Pacific
- Latin America
- The Middle East and Africa
For inquiries regarding discounts, bulk purchases, or customization requests, please contact us at sales@precedenceresearch.com
Frequently Asked Questions
Tags





Ask For Sample
No cookie-cutter, only authentic analysis – take the 1st step to become a Precedence Research client
 Get a Sample
.webp)



 sales@precedenceresearch.com
 Schedule a Meeting